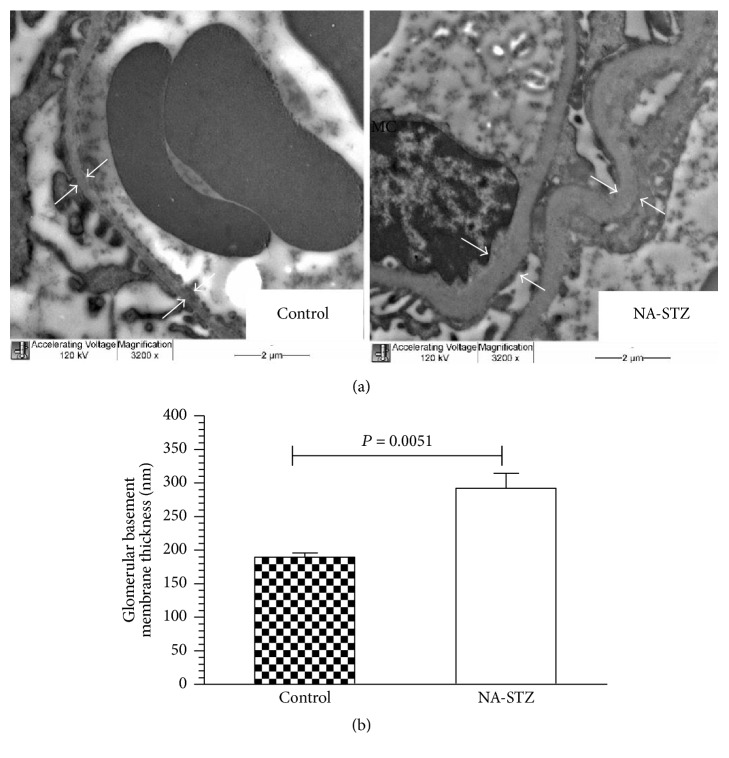
Figure 9.
The results of transmission electron microscopic examination in control and NA-STZ-induced diabetic groups at week 30. (a) Representative electron microphotographs (magnification ×3200): white arrows indicate the thickness of the GBM. (b) Quantification of the thickness of the GBM from control nondiabetic and NA-STZ-induced diabetic groups. Mean values and standard deviations are shown.

