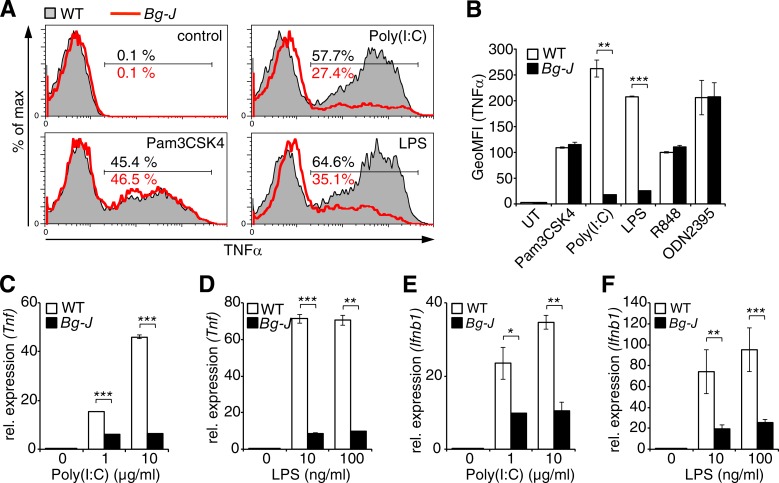
Figure 2.
Lyst controls TLR3- and TLR4-induced inflammatory cytokine gene expression. (A and B) BMDCs from WT and Bg-J mice were stimulated for 6 h with the indicated TLR ligands in the presence of brefeldin A. Cells were subsequently subjected to intracellular staining for TNF and analyzed by flow cytometry. Representative flow cytometric histograms (WT, shaded; Bg-J, red lines; A) and the geometric mean fluorescence intensity (GeoMFI; B) ± SD from two cultures derived from different mice are shown. UT, untreated. (C–F) Quantitative real-time PCR analysis of Tnf (C and D) and Ifnb1 (E and F) mRNA levels in BMDCs from WT and Bg-J mice stimulated with the indicated concentrations of poly(I:C) (C and E) and LPS (D and F). Data are means ± SD from two cultures derived from different mice. rel., relative. *, P < 0.05; **, P < 0.01; ***, P < 0.001 (Student’s t test). All data are representative of at least three independent experiments.

