Figure 7.
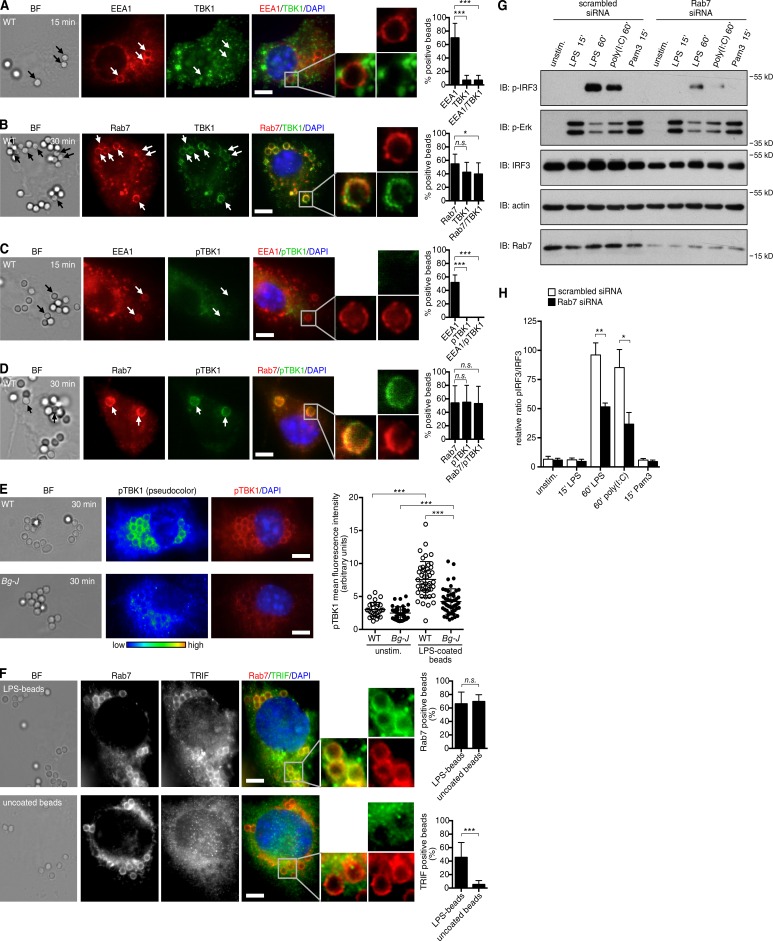
Rab7+ endosomal compartments serve as a platform for TRIF signaling. (A–D) WT BMDMs were exposed to LPS beads (2 µm diameter). After 15 (A and C) and 30 (B and D) min of incubation, cells were fixed, permeabilized, and stained for EEA1 and TBK1 (A), Rab7 and TBK1 (B), EEA1 and phosphorylated TBK1 (pTBK1; C), and Rab7 and phosphorylated TBK1 (D). Nuclei were counterstained with DAPI. Arrows indicate EEA1+ or Rab7+ beads. Enlargements show EEA1+ or Rab7+ phagosomes. Bars, 5 µm. BF, bright field. (Right) Graphs show quantification of percentages of bead-containing phagosomes that were positive for the indicated markers. Number of evaluated bead-containing phagosomes: (A) n = 66; (B) n = 103; (C) n = 37; (D) n = 84. (E) WT and Bg-J BMDMs were exposed to LPS beads. After 30 min of incubation, cells were fixed and stained for phosphorylated TBK1. Nuclei were counterstained with DAPI. Phosphorylated TBK1 staining is shown in pseudocolor to highlight signal intensity. Bars, 5 µm. (Right) The graph on the right shows cellular pTBK1 staining intensity (mean fluorescence intensity in arbitrary units) in WT and Bg-J cells stimulated for 30 min with LPS beads and in unstimulated (unstim.) control cells. Each circle corresponds to an individual cell (n ≥ 65). (F) THP-1 cells were differentiated into macrophage-like cells and were exposed to LPS beads or uncoated control beads. After 60 min of incubation, cells were fixed, permeabilized, and stained for Rab7 and TRIF. Nuclei were counterstained with DAPI. Enlargements show bead-containing phagosomes. Bars, 5 µm. (Right) The graphs show quantification of percentages of bead-containing phagosomes (LPS beads and uncoated control beads, respectively) that were positive for Rab7 (top) or TRIF (bottom). Greater than 150 bead-containing phagosomes were evaluated for each condition. (A–F) Mann-Whitney U test was used. Error bars represent SD. (G and H) BMDMs transfected with siRNA against Rab7 or scrambled control siRNA were stimulated for the indicated times with 100 ng/ml LPS, 10 µg/ml poly(I:C), or 100 ng/ml Pam3CSK4 (Pam3). Whole cellular lysates were analyzed by immunoblotting (IB) for phosphorylated IRF3, phosphorylated Erk1/2, IRF3, actin, and Rab7. (H) Densitometric analysis of immunoblots showing the ratio of phosphorylated IRF3 band intensities to total IRF3 (arbitrary units; n ≥ 3). Data are mean ± SEM. Student’s t test was used. *, P < 0.05; **, P < 0.01; ***, P < 0.001. All data are representative for at least three independent experiments.

