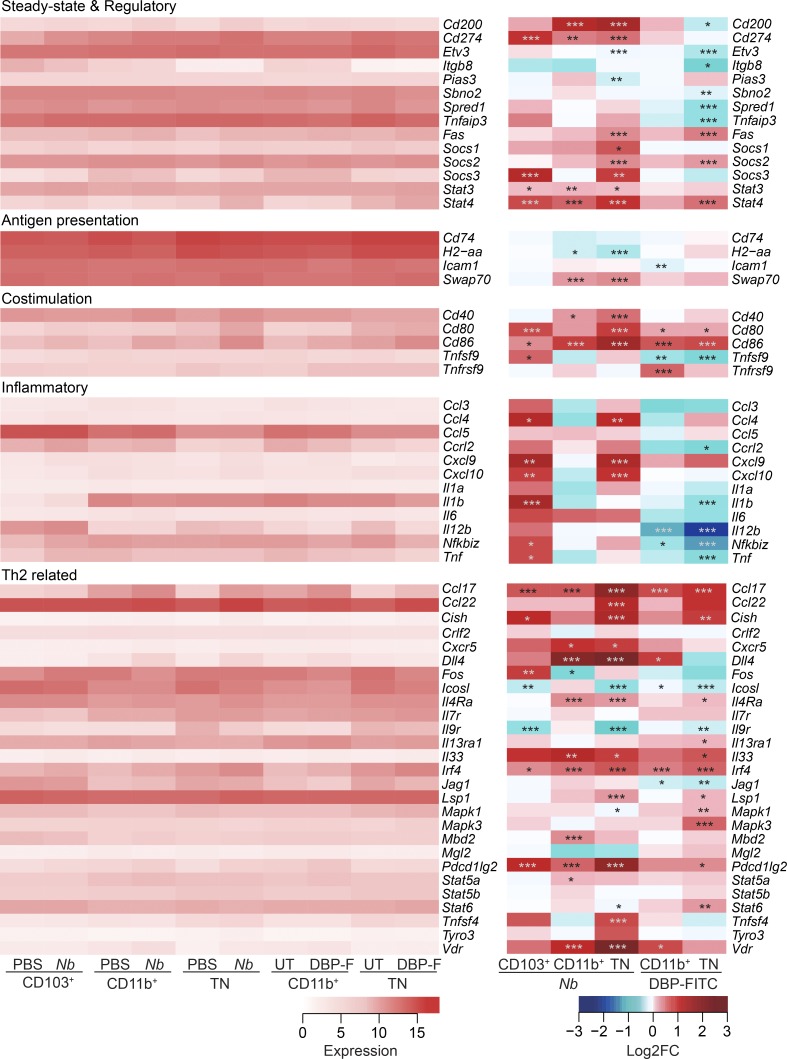
Figure 2.
Expression of genes involved in DC function after immunization with Nb or DBP-FITC. LN were collected from C57BL/6 mice immunized with 600 Nb, DBP-FITC, or mock treated. DC subsets were flow sorted as in Fig. S1 for RNA preparation and sequencing. Heat maps on the left show the levels of expression of genes associated with different DC functions or with the induction of Th2 immune responses as indicated. Differential expression analysis in treated groups is on the right. DC expression data are the mean of three replicate samples each from an independent experiment for each Th2 condition. P-values were calculated by DESeq2; *, P < 0.05; **, P < 0.01; ***, P < 0.001.

