Figure 4.
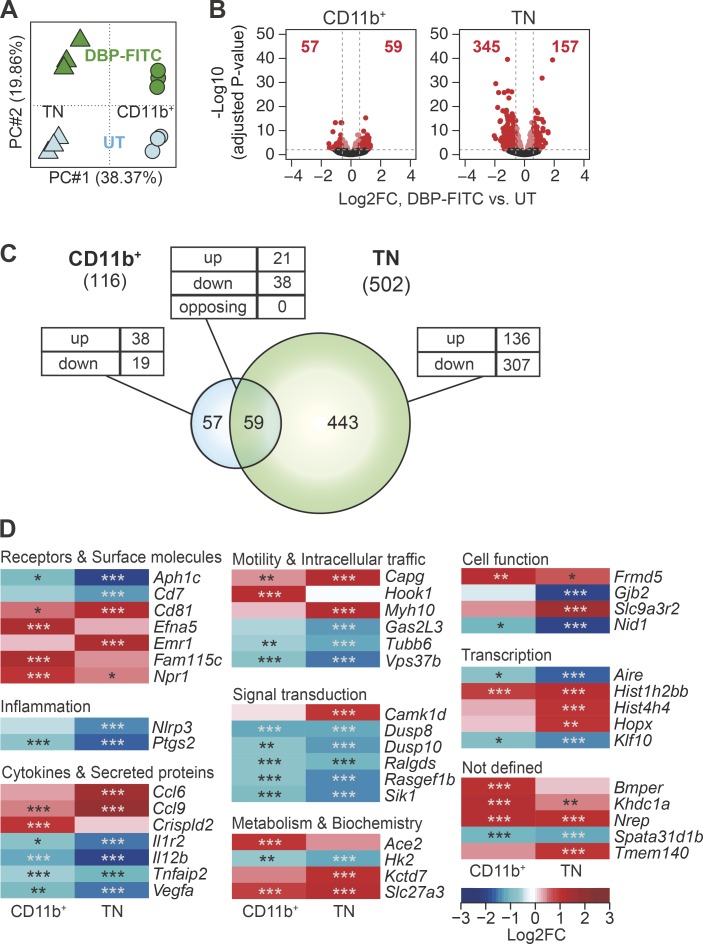
Treatment with DBP-FITC is associated with profound transcriptional changes preferentially affecting TN DCs. (A) PCA of genes expressed in CD11b+ and TN DCs from mice treated with DBP-FITC or mock-treated (UT). (B) Volcano plots comparing gene expression in DC subsets from DBP-FITC–treated or UT mice. FC, fold change. Bright red dots and dashed lines identify the genes scored as differentially expressed in each DC subset (Log2FC > ±0.585 and adjusted P < 0.01). The number of up- or down-regulated genes for each comparison is shown in red. (C) Venn diagram showing the relationship between numbers of DEG after treatment with DBP-FITC versus UT in the CD11b+ and TN subsets. The total number of DEG in each subset is given in parentheses. The numbers of DEG unique to each DC subset or shared between populations are shown within the diagram; the numbers of genes that were up-regulated (up), down-regulated (down), or, for intersections, discordantly regulated (opposing) in different DC subsets compared to control are also shown. (D) Heat map showing a selection of the top DEG in CD11b+ and TN DCs. DC expression data are the mean of three replicate samples each from an independent experiment. P-values were calculated by DESeq2. *, P < 0.05; **, P < 0.01; ***, P < 0.001.

