Figure 5.
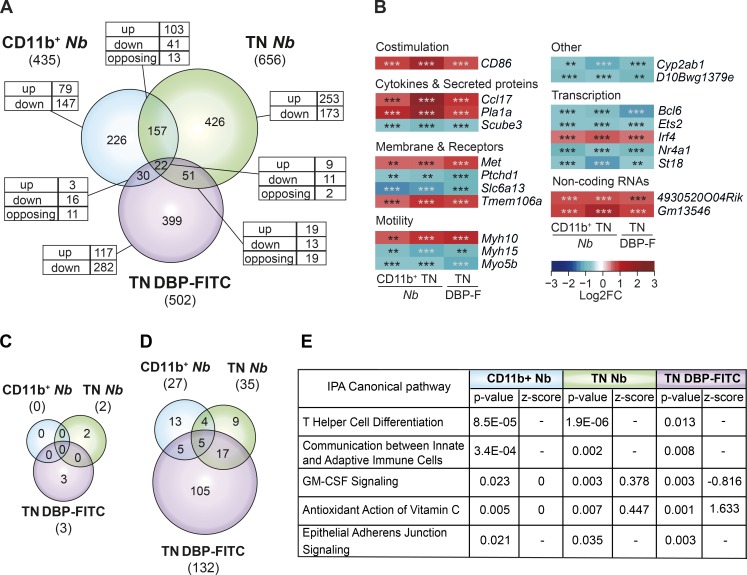
The transcriptional profiles of DCs that prime Th2 responses are heterogeneous. (A) Venn diagram showing the relationship between the numbers of DEG in CD11b+ and TN DCs from mice treated with 600 Nb versus PBS, and TN DCs from mice treated with DBP-FITC versus UT. The total number of DEG in each subset is given in parentheses. The numbers of DEG unique to each DC subset or shared between populations are shown within the diagram; the numbers of genes that were up-regulated (up), down-regulated (down), or, for the intersection, discordantly regulated (opposing) are also shown. (B) Heat map of the 20 genes that were concordantly regulated in CD11b+ and TN DCs from Nb mice, and TN DCs from DBP-FITC. DC expression data are the mean of three replicate samples each from an independent experiment for each Th2 condition. P-values were calculated by DESeq2; **, P < 0.01; ***, P < 0.001. (C) Venn diagram showing the number of canonical signaling pathways identified as differentially regulated in each DC subset using IPA. Pathways were scored as differentially regulated when the z-score was >+2 or <−2, and P < 0.05. (D) As in C, except that differentially regulated pathways were selected only on the basis of P < 0.05, and no z-score threshold was applied. (E) Description, p-value, and z-score of differentially regulated pathways shared between CD11b+ and TN DCs from Nb mice, and TN DCs from DBP-FITC as identified in D. Where z-score = 0, the direction of a pathway could not be predicted; −, z-score was not assigned.

