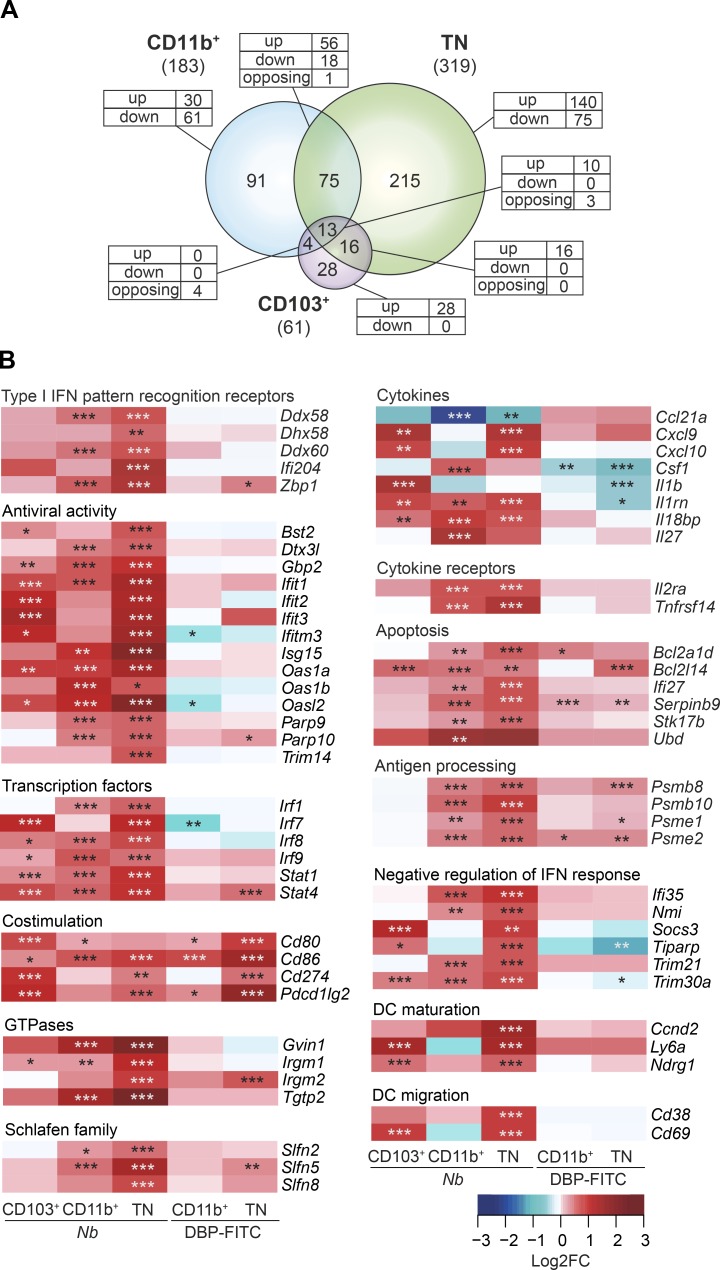
Figure 6.
Expression of genes associated with IFN-I signaling in DCs from Nb or DBP-FITC–treated mice. (A) Venn diagram showing the relationship between numbers of IFN-I-regulated DEG after treatment with Nb versus PBS in CD11b+, TN, and CD103+ DC subsets. The total numbers of IFN-I–regulated DEG in each subset is given in parentheses. The numbers of IFN-I–regulated DEG unique to each DC subset or shared between populations are shown within the diagram; the numbers of genes that are up-regulated (up), down-regulated (down), or, for intersections, discordantly regulated (opposing) in different DC subsets compared with control are also shown. (B) Heat maps showing a selection of IFN-I–regulated DEG in DC subsets from Nb-treated and DBP-FITC–treated mice. DC expression data are the mean of three replicate samples each from an independent experiment for each Th2 condition. P-values were calculated by DESeq2; *, P < 0.05; **, P < 0.01; ***, P < 0.001.

