Figure 7.
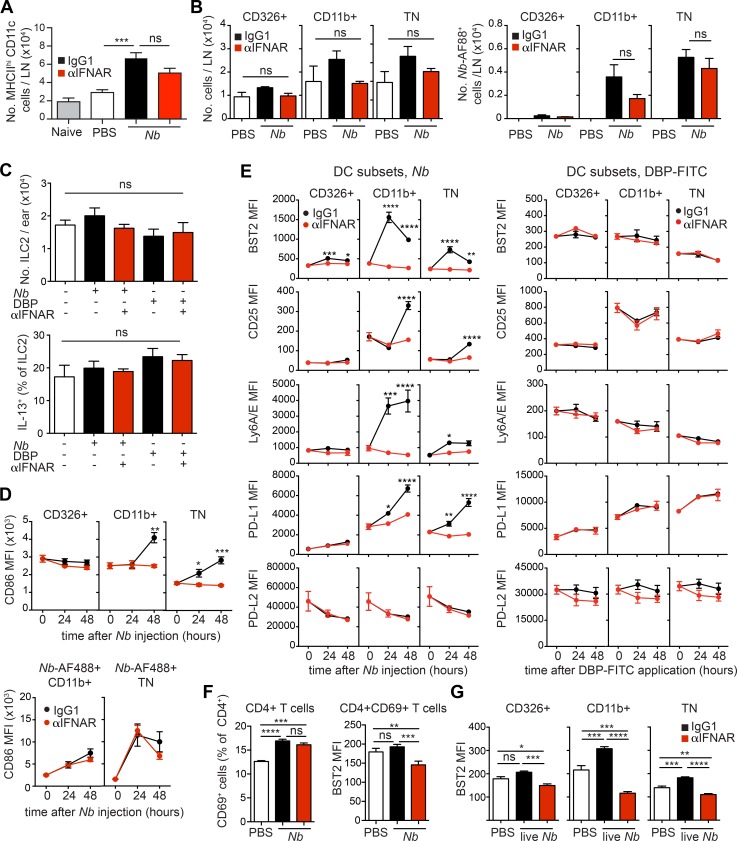
DCs from Nb-treated mice express a pronounced IFN-I signature. C57BL/6 and (C57BL/6 × 4C13R)F1 IL-4/IL-13 double reporter mice were treated with PBS, 300 Nb, or DBP-FITC coadministered with αIFNAR or IgG1 isotype control as indicated. Ear skin or dLN were harvested at the indicated time points for flow cytometric analysis. (A) Numbers of total MHCIIhiCD11c+ DCs in the dLN of C57BL/6 mice treated 48 h earlier with Nb and αIFNAR, as indicated. Bar graphs show mean + SEM for six separate experiments each with four to five mice/group, except for the Naive group, which refers to one experiment with four mice. (B) As in A, except that mice were injected with Nb-AF88 48 h earlier. Numbers of total CD326+ (which includes the CD103+ DC and LC subsets), CD11b+, and TN DCs, and of Nb-AF488+ DCs, are shown. Bar graphs show mean + SEM for three separate experiments each with three to five mice/group. (C) Numbers of iLC2 per ear and percentage of IL-13-dsRed+ iLC2 as measured in 4C13R double reporter mice 24 h after the indicated treatments. Bar graphs show mean + SEM for three to four mice/group. Data refer to one of two repeat experiments that gave similar results. (D) Flow cytometric analysis of DC subsets from C57BL/6 mice immunized with Nb or Nb-AF488 and treated with αIFNAR or IgG1 isotype control as indicated. Mean MFI values ± SEM for five mice/group are shown for each time point. Data refer to one of two repeat experiments that gave similar results. (E) Flow cytometric analysis of DC subsets from C57BL/6 mice immunized with Nb or DBP-FITC and treated with αIFNAR or IgG1 isotype control as indicated. Mean MFI values ± SEM for five mice/group are shown for each time point. Analyses of Nb or DBP-FITC responses were performed in different experiments, thus MFI values are not directly comparable across treatments. Data refer to one of two repeat experiments that gave similar results. (F) C57BL/6 mice were treated as in B. Bar graphs show expression of CD69 and BST2 on LN CD4+ T cells at 48 h after Nb immunization. Mean + SEM for five mice/group; data refer to one of two repeat experiments that gave similar results. (G) As in B, except that C57BL/6 mice were injected with 300 live N. brasiliensis L3 larvae; dLN were collected for flow cytometric analysis at 48 h after immunization. Bar graphs show mean + SEM for five mice/group. Data refer to one of two repeat experiments that gave similar results. P-values were determined using one-way ANOVA with the Bonferroni post-test, except for panels in E, which were determined using a two-way ANOVA with the Bonferroni post-test; *, P < 0.05; **, P < 0.01; ***, P < 0.001; ****, P < 0.0001; ns, not significant.

