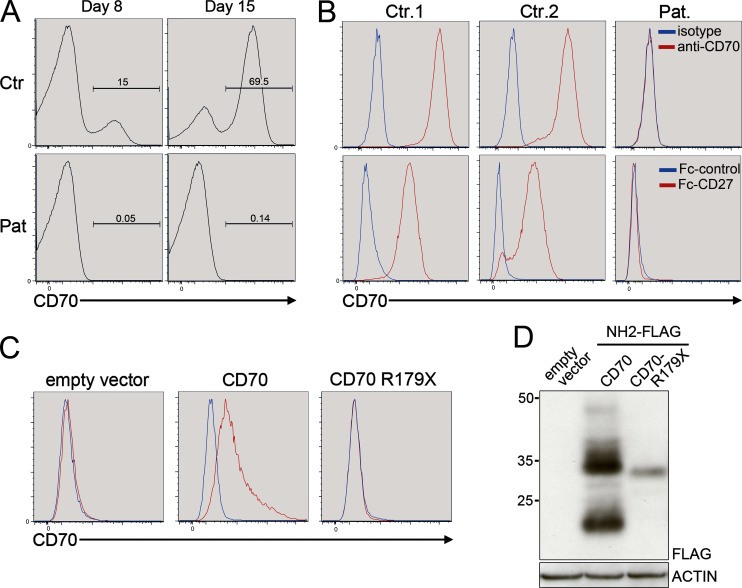
Figure 2.
The R179X mutation in CD70 prevents binding to CD27. (A) FACS histograms showing CD70 expression detected with anti-CD70 antibody on PHA-stimulated T cells from the patient (Pat.) or a healthy control (Ctr) at days 8 and 15 of culture. Numbers inside the histograms correspond to the percentage of positive cells. One representative of three independent experiments is shown. (B) FACS histograms showing CD70 expression on LCLs from the patient or two healthy control individuals (Ctr.1 and Ctr.2) detected with anti-CD70 antibody (top) or revealed by the ability of CD70 to bind CD27-Fc fusion protein (bottom). One representative of three independent experiments is shown. (C) Histograms showing the binding of a CD27-Fc fusion protein on HEK 293 T cells transfected with an empty expression vector (empty vector) or a vector containing cDNAs coding of either NH2-FLAG–tagged CD70 (CD70) or NH2-FLAG–tagged R179X CD70 (CD70 R179X). One representative of two independent experiments is shown. (D) Same as C, expect that CD70 expression was analyzed by Western blotting in cell lysates using anti-FLAG antibody. Molecular weights in kilodaltons are shown on the left. One representative of two independent experiments is shown.

