Figure 3.
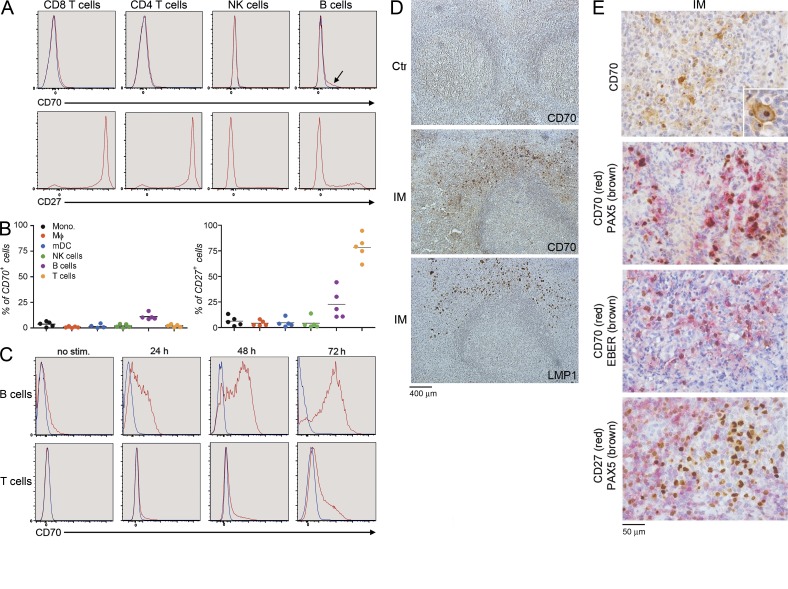
CD70 expression is up-regulated in activated B lymphocytes and EBV-infected B cells. (A) FACS histograms showing the expression of CD70 (top) or CD27 (bottom) on the different lymphoid subpopulations from PBMCs of one healthy donor. (Top) The control isotype is shown by the blue line, whereas the red line corresponds to anti-CD70 or -CD27 staining. The arrow indicates the population of B cells expressing CD70. One representative of three independent experiments is shown. (B) Percentage of CD70- or CD27-expressing cell populations among PBMCs of five healthy donors from FACS analysis stained with markers for macrophages (Mφ), monocytes (Mono), dendritic cells (mDC), T cells, B cells, and NK cells. Data from two independent experiments are shown. n = 5. (C) FACS histograms showing the expression of CD70 on B cells and T cells from PBMCs of a healthy individual that have been activated for different periods of time with PMA + ionomycin. The blue line corresponds to the isotype, whereas the red line corresponds to the anti-CD70 antibody. One representative of three independent experiments is shown. stim., simulation. (D) Analysis of CD70 expression on tonsils of one healthy control (Ctr) and one individual with infectious mononucleosis (IM). Immunostaining for CD70 and LMP-1 expression is shown. (E) Immunostaining of tonsils from one individual with infectious mononucleosis for CD70, PAX5 (B cell marker), EBER probe, and CD27 expression. Large cells are CD70 positive (inset) with a membrane and an intracytoplasmic (dot) staining (top). CD70-positive cells are PAX5+ and EBV+ (EBER; middle), and CD27 is not expressed on the PAX5+ cells (bottom). One representative of two experiments with two different individuals with IM tested.

