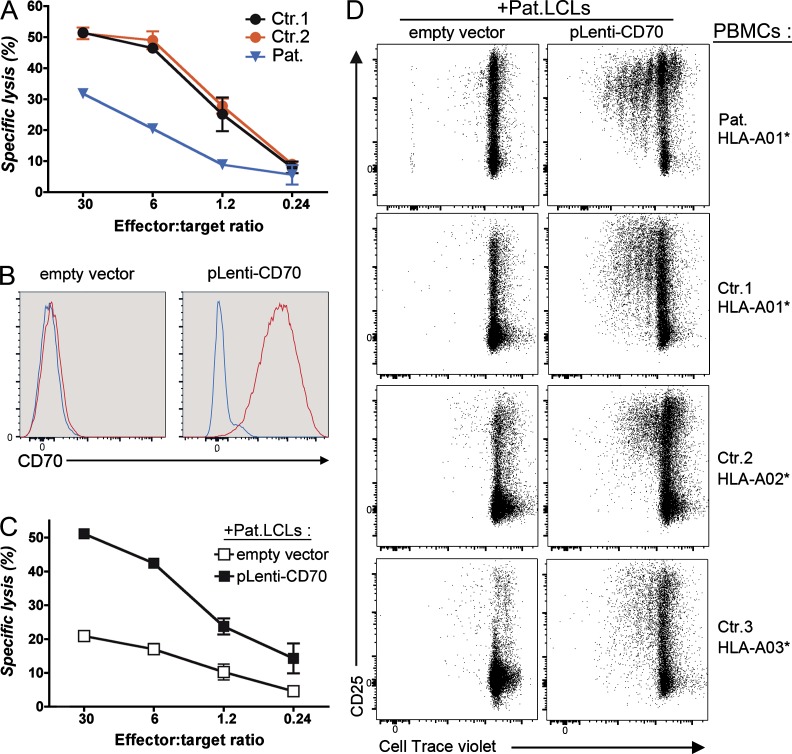
Figure 4.
Decreased cytolytic and proliferative responses to autologous CD70-deficient LCLs of the patient are restored by expression of CD70 in LCLs. (A) Cytotoxic response of T cells from two control individuals (Ctr.1 and Ctr.2) and the CD70-deficient patient (Pat.) against autologous LCLs as measured by Cr51 release at the indicated effector-to-target ratios. T cells have been co-cultured with the autologous LCLs for 4 wk before the test. One representative of two independent experiments and triplicates with SD are shown. (B) FACS histograms of CD70 expression on LCLs of the patient that have been infected with an empty lentiviral vector (empty vector) or a vector containing a cDNA coding wild-type CD70 (pLenti vector). One representative of five independent experiments is shown. (C) Same as A except that T cells from the patient were co-cultured with autologous CD70-deficient LCLs of the patient (Pat.LCLs) in which CD70 expression was restored (pLenti-CD70) or not (empty vector). Duplicates with SD are shown. (D) Proliferation of T cells from PBMCs of the patient and HLA-A matched (Ctrl.1 HLA-A01*) or nonmatched (Ctr.2 HLA-A02* and Ctr.3 HLA-A03*) healthy controls that were co-cultured for 8 d in the presence of irradiated CD70-deficient LCLs of the patient in which CD70 expression was restored or not. Representative dot plots of violet dye dilution and CD25 expression gated on CD3+ cells are shown. Numbers inside the gates correspond to the percentage of dividing cells. One representative of five independent experiments is shown.

