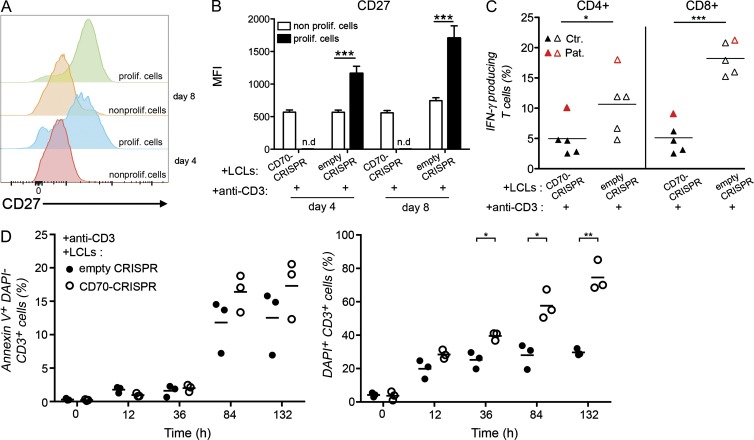
Figure 7.
Proliferating T cells that expand in response to CD70 expressed CD27 and are effector cells. (A) Example of FACS histograms of CD27 expression at days 4 and 8 on T cells from PBMCs of one healthy donor that have been cultured in the presence of irradiated CD70-expressing LCLs (empty CRISPR) preincubated with anti-CD3 antibody. Proliferation is analyzed the same as in Fig. 6 B. Proliferating (prolif.) T cells gated on CD3+ cells correspond to cells having at least achieved one division measured by CellTrace violet dye dilution. One representative experiment of five independent experiments is shown. (B) Mean fluorescence intensity (MFI) of CD27 expression calculated from FACS histograms corresponding to A. Means with SEM are presented. Data are from five independent experiments. (C) Intracellular IFN-γ expression from FACS analysis in CD4+ or CD8+ T cells from PBMCs of four different control (Ctr.) individuals and the patient (Pat.; red; n = 5) that have been cultured in the presence of irradiated LCLs (+LCLs) expressing (empty CRISPR) or not expressing (CD70-CRISPR) CD70 preincubated with anti-CD3 antibody (+anti-CD3). Before being tested for cytokine expression by FACS, T cells were restimulated with anti-CD3 antibody for 12 h. (D) Apoptosis and cell death of CD3+ T cells from FACS analysis with staining with annexin V and DAPI of PBMCs from three different healthy controls that have been cultured in the presence of irradiated LCLs expressing or not expressing CD70 preincubated with anti-CD3 antibody for different periods of time. Left and right panels correspond to apoptotic cells (annexinV+DAPI−CD3+ cells) and dead cells (DAPI+CD3+ cells), respectively. Each point corresponds to a mean of duplicates. (B–D) Unpaired Student’s t tests were used. *, P < 0.05; **, P <0.001; ***, P < 0.0001.

