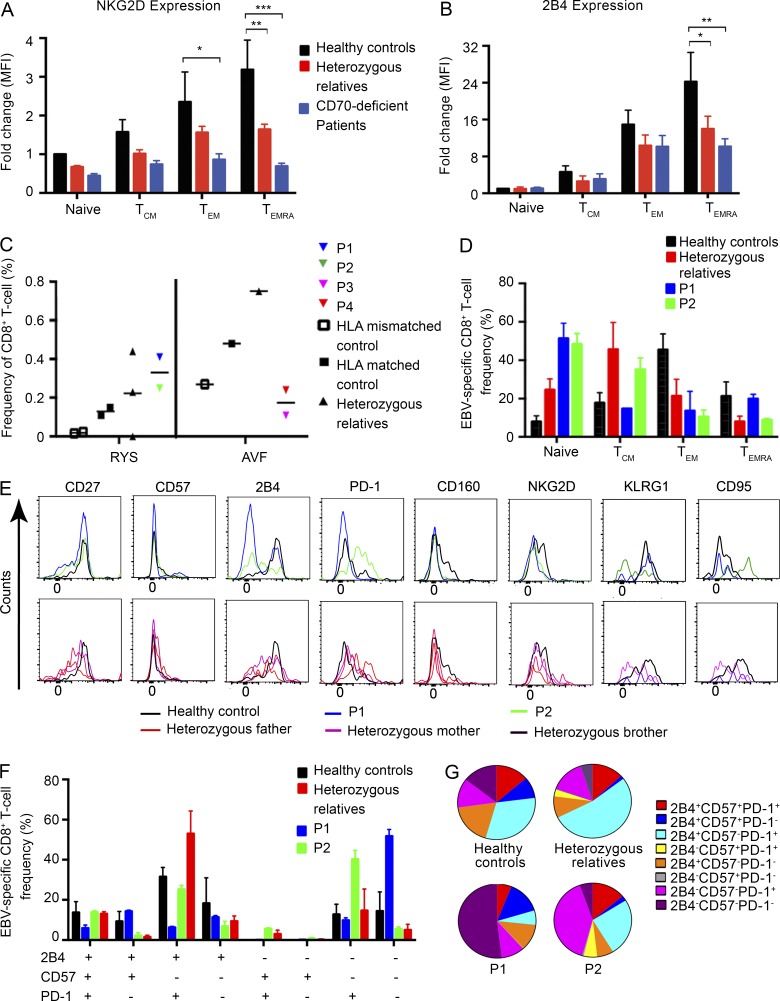
Figure 3.
Phenotype of EBV-specific CD8+ T cells in CD70-deficient individuals. (A and B) PBMCs from healthy donors (n = 5), heterozygous carriers (n = 5), and CD70-deficient patients (n = 4) were labeled with mAbs against CD3, CD8, CD45RA, CCR7, NKG2D, and 2B4. Naive (CD45RA+CCR7+), TCM (CD45RA−CCR7+), TEM (CD45RA−CCR7−), and TEMRA (CD45RA+CCR7−) CD8+ T cells were identified, and then, expression of NKG2D (A) and 2B4 (B) on each subset was determined. Data are expressed as fold-change in mean fluorescence intensity (MFI; mean ± SEM) relative to expression on naive CD8+ T cells from healthy donors (normalized to 1). The statistics were performed by two-way ANOVA. *, P < 0.05; **, P < 0.01; ***, P < 0.001. (C) Frequency of EBV-specific CD8+ T cells based on staining with the HLA-A*2402–RYSIFFDY (RYS) or HLA-A*1101–AVFDRKSDAK (AVF) tetramer in CD70-deficient individuals (n = 4), heterozygous family members (n = 4), and HLA-matched (n = 3) and -mismatched (n = 3) controls. (D) Total frequency of EBV tetramer+ CD8+ T cells (HLA-A*2402–RYS) in naive, TCM, TEM, and TEMRA CD8+ T cell populations in P1 and P2, heterozygous family members (n = 3), and HLA-matched controls (n = 3). Error bars represent mean ± SEM, and experiments for each patient were done on two separate occasions. (E) Expression of CD57, 2B4, PD-1, CD27, CD160, NKG2D, KLRG1, and CD95 on EBV-specific CD8+ T cells from P1 and P2, heterozygous family members (n = 3), and healthy controls (n = 2). (F and G) Overlays and SPICE chart of coexpression of regulatory markers of CD57, 2B4, and PD-1 in tetramer+ CD8+ T cells. (F) Error bars represent mean ± SEM, and experiments for each patient were done on two separate occasions. All data are representative of two individual experiments.

