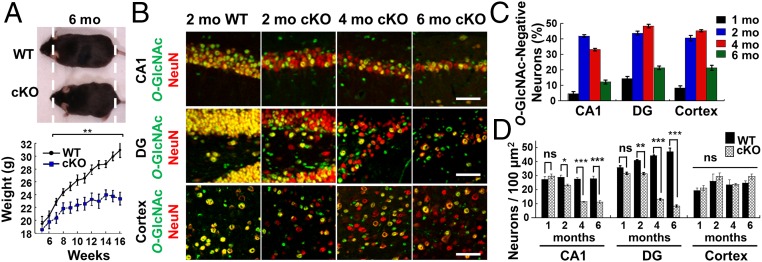
Fig. 1.
Characterization of OGT knockout and neuronal loss. (A) OGT cKO mice were smaller than WT mice and displayed significantly reduced weight gain beginning at 7 wk. (B) An anti–O-GlcNAc antibody was used to image total O-GlcNAc levels (green) in hippocampal NeuN+ neurons (red). (C) Quantification of O-GlcNAc− neurons in the CA1, DG, and cortical regions. (D) Quantification of NeuN+ neurons illustrates neuronal loss in the CA1 and DG of OGT cKO mice. *P < 0.05, **P < 0.005, ***P < 0.0005. (Scale bars: 50 µm.)

