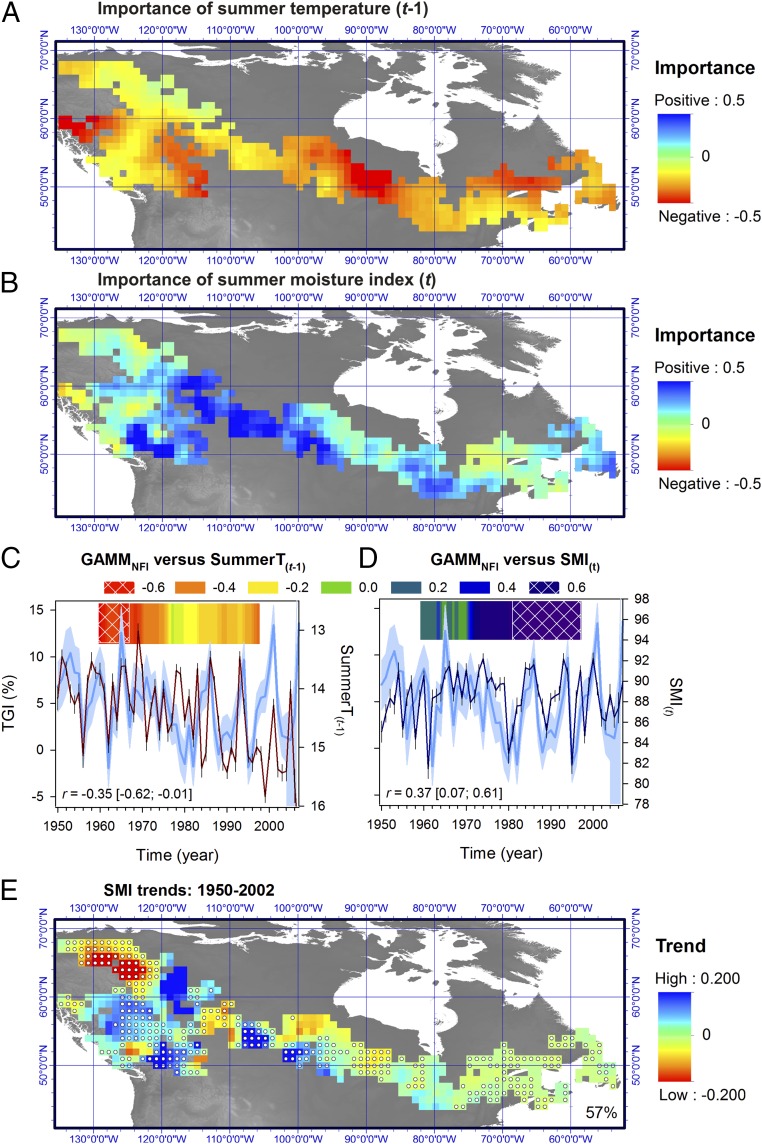
Fig. 6.
Importance of summer temperature and soil moisture on forest growth. Maps in A and B were created by applying a kriging procedure to the plot-level species-specific sums of Akaike weights for these two variables. The sign of the relationship (positive and negative) was given by the averaged model coefficients. (C and D) Averaged Canada-wide species-by-plot chronologies over 1950–2007 (blue curve) plotted against mean summer temperature of the year previous to growth and summer soil moisture index (SMI) of the year of growth. Shaded area delineates the 90% confidence interval for the growth estimates. Note the inverted y scale on the temperature axis. The Spearman correlation r between time series is shown with the 95% confidence intervals computed using a bootstrapping technique accounting for serial persistence in data. The Inset color graphs show 20-y moving window correlation analyses between variables (dark blue and dark red for positive and negative correlation, respectively). Note the shift of the climate relationship from temperature to SMI at the national level starting ∼1970. (E) Spatial distribution of trends in SMI across sampled boreal Canada from 1950 to 2002 (in millimeters per year). Dots on maps indicate areas for which trends in SMI and GAMMNFI (Fig. 2B) were of the same sign (the percent agreement is indicated).

