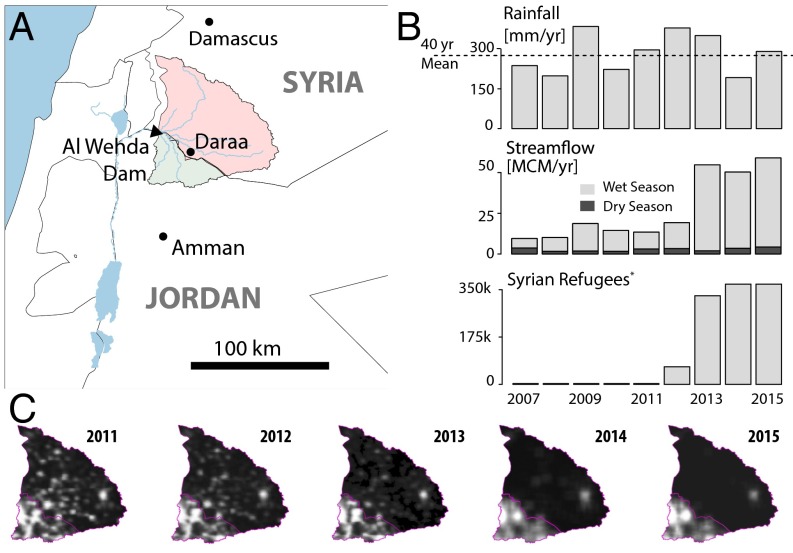
Fig. 1.
Yarmouk river flow increase coincides with refugee migration. (A) Map of the Yarmouk basin upstream of the Al-Wehda dam, with the Syrian and Jordanian parts of the basin (red and green), and the Al-Wehda dam, where stream flow is measured. (B) Time series of annual precipitation spatially averaged over the Yarmouk basin (Top, with long-term average represented as a dashed line), annual discharge volumes measured at Al-Wehda disaggregated by wet (October to May) and dry (June to September) seasons (Middle), and the cumulative number of registered refugees from the Syrian part of the basin (Bottom). (C) Annual average night-light intensity images of the Yarmouk region, from the Defense Meteorological Satellite Program Operational Line Scanner (DMSP-OLS) and Visible Infrared Imaging Radiometer Suite (VIIRS) satellite, illustrate the timing and magnitude of refugee migration out of the Syrian part of the basin. There is a clear decrease in night-light intensity in Syria when comparing images across three periods: (i) in 2011, before the war; (ii) in 2013, during the peak of refugee migration from Jordan to Syria; and (iii) in 2014–2015, during which the rate of migration decreases. In contrast, night-light intensity in Jordan during this entire 5-y period remained relatively constant. VIIRS images for 2014 and 2015 were downscaled and adjusted to match the resolution and average intensity (in the Jordanian portion of the basin) of DMSP-OLS images used for previous years.

