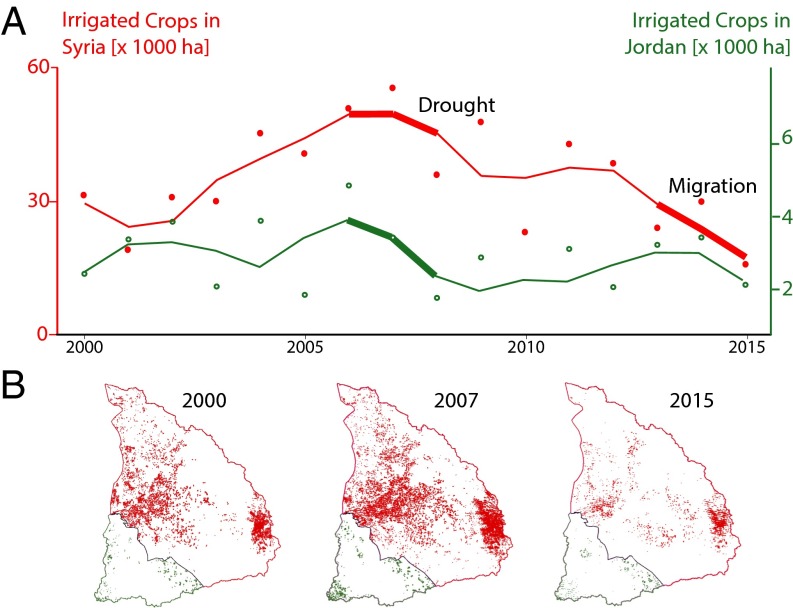
Fig. 2.
Remote sensing detection of irrigated regions. (A) Time series graphs of annual extent of irrigated areas in the Yarmouk basin, excluding irrigated olives, for Syria (red) and Jordan (green). Dots (n = 16) represent point estimates obtained from Landsat 7 imagery and used in the statistical analyses. Lines are obtained by a local polynomial regression fit (span = 0.5) to reduce observation errors and illustrate land use trends. Decreases in irrigated land surface corresponding to the 2006–2008 drought are clearly visible for both countries, whereas a second significant drop occurs only in Syria after 2012, during refugee migration. (B) Maps of irrigated areas for 2000, 2007, and 2015 (1 pixel = 30 × 30 m) illustrate the extent of the change in land use.

