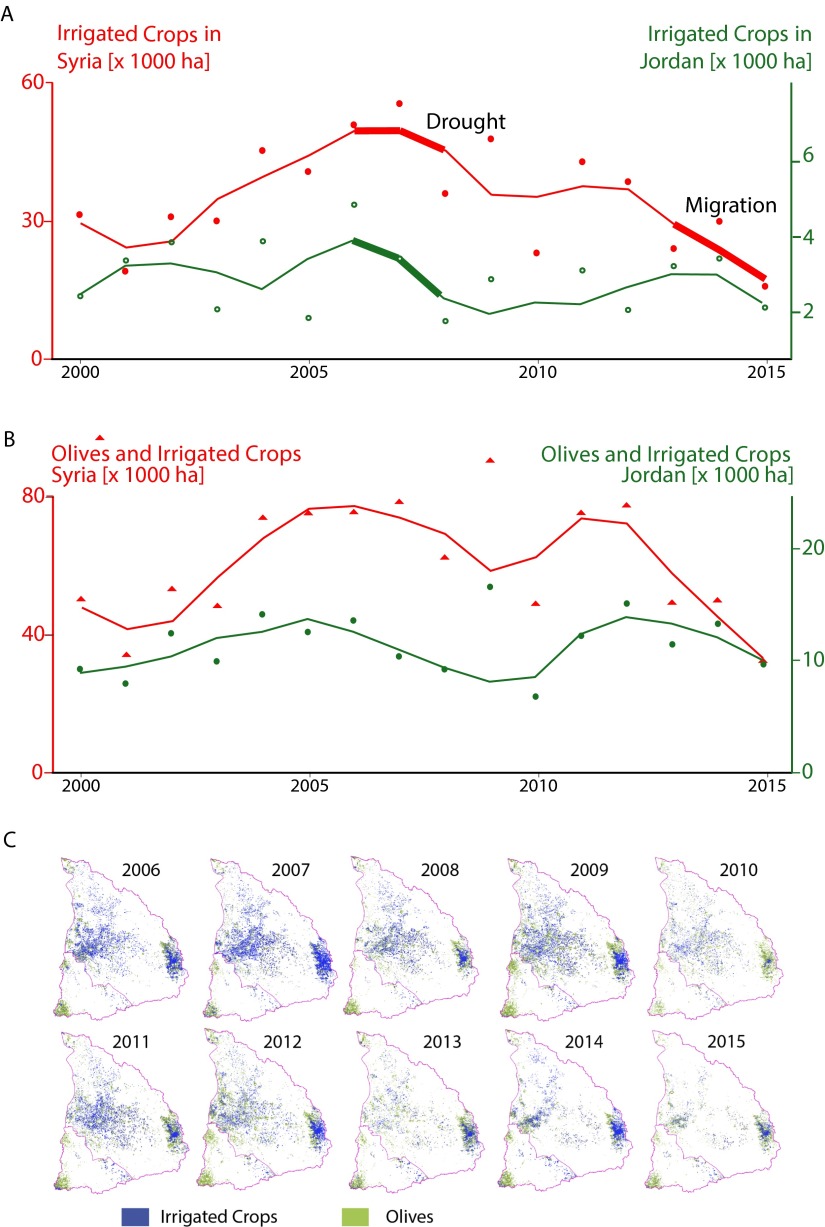
Fig. S2.
Land use classification results. Time series of irrigated area by country and calendar year, excluding (A) and including (B) irrigated and rain-fed olives (n = 16 per series), are presented. Although local polynomial regressions (span = 0.4) are used for illustrative purposes to minimize random observation errors on the figures (lines), the original point estimates obtained from Landsat 7 imagery (dots) are used for statistical inference. Both panels show an abrupt drop occurring predominantly in Syria after 2012, coinciding with the period of maximum refugee migration to Jordan, suggesting a detectable relation between migration and reduced agricultural water use that remains robust to systematic underestimation (A) and overestimation (B) of irrigated areas. (C) Annual maps of irrigated crops and olives (pixel size: 30 × 30 m).

