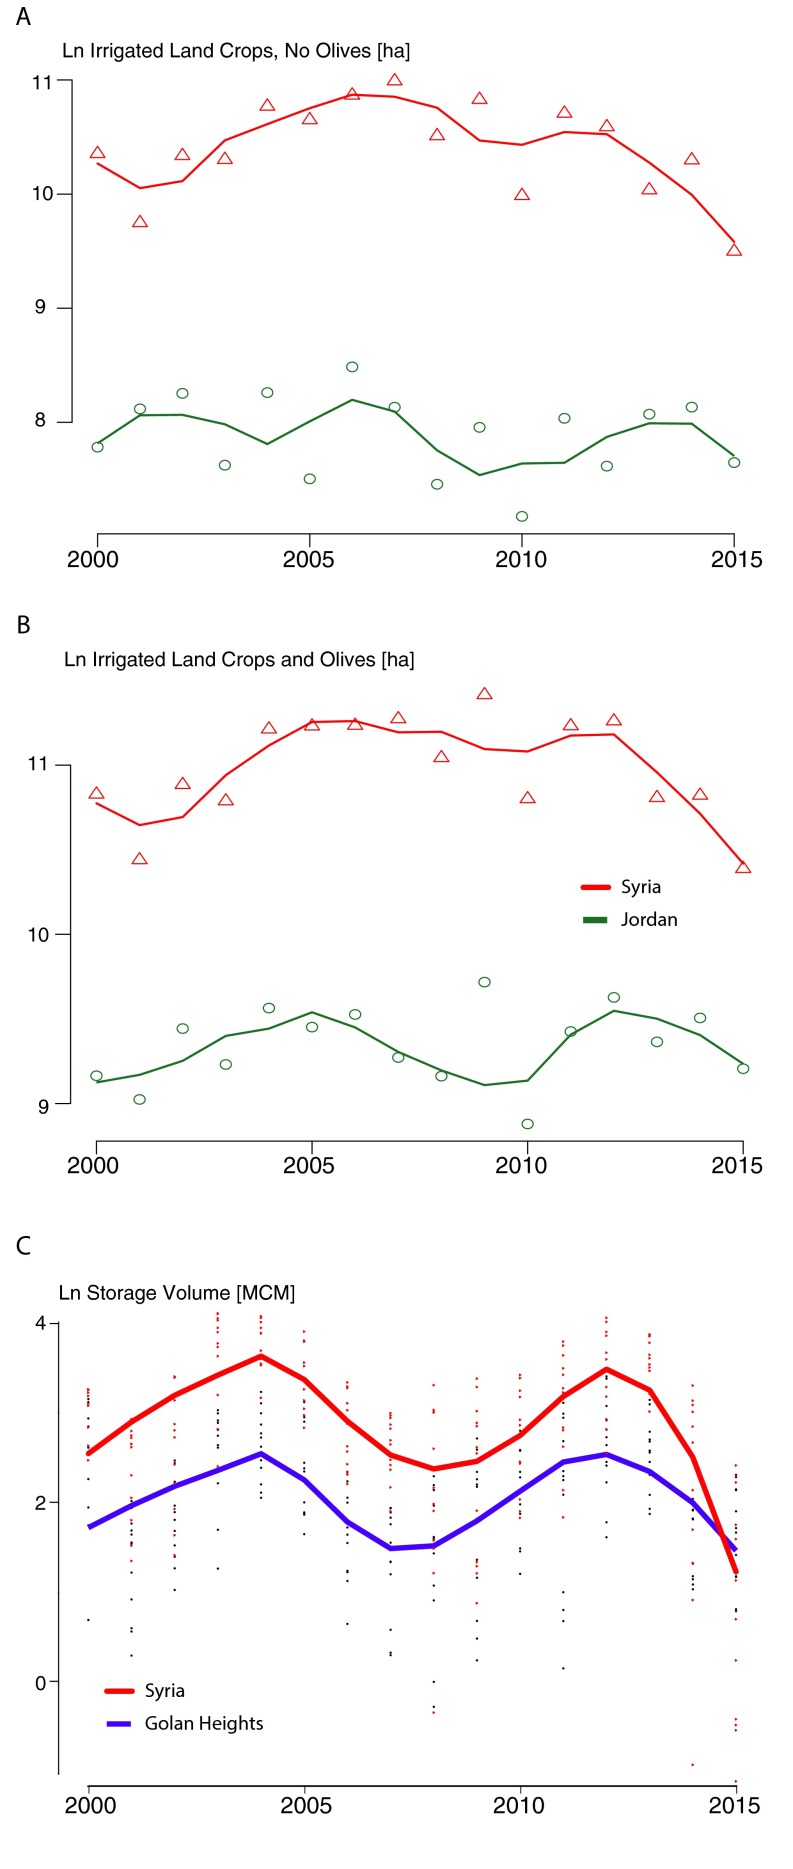
Fig. S8.
Time series of irrigated land areas by region representing the data used in the differences-in-differences analysis (n = 16 per series for land use and n = 189 per series for reservoir storage): natural log (Ln) irrigated areas without (A) and with (B) olives and Ln storage volume (C). Dots represent point estimates obtained from Landsat 7 imagery, and lines are obtained by local polynomial regression fitting (span = 0.5). All three panels suggest that the considered outcomes would follow similar trajectories in Syria and in the control region absent the refugee crisis, as seen in the similar shapes of the curves before 2013.

