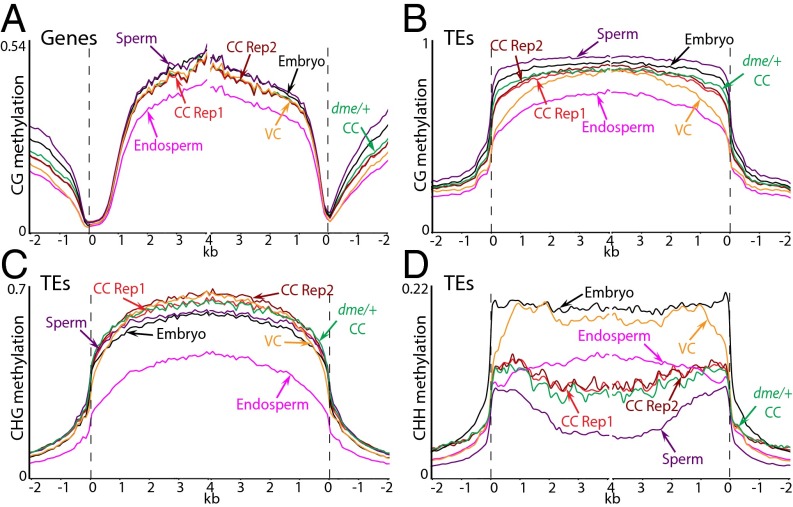
Fig. 2.
DNA methylation in Arabidopsis central cells in comparison with other cell types. Genes (A) and TEs (B–D) were aligned at the 5′ and 3′ ends. Methylation within each 100-bp interval was averaged and plotted from 2 kb away from the annotated gene or TE (negative numbers) to 4 kb into the annotated region (positive numbers). The dashed lines represent the points of alignment. Previously published data are from ref. 10.

