Fig. 5.
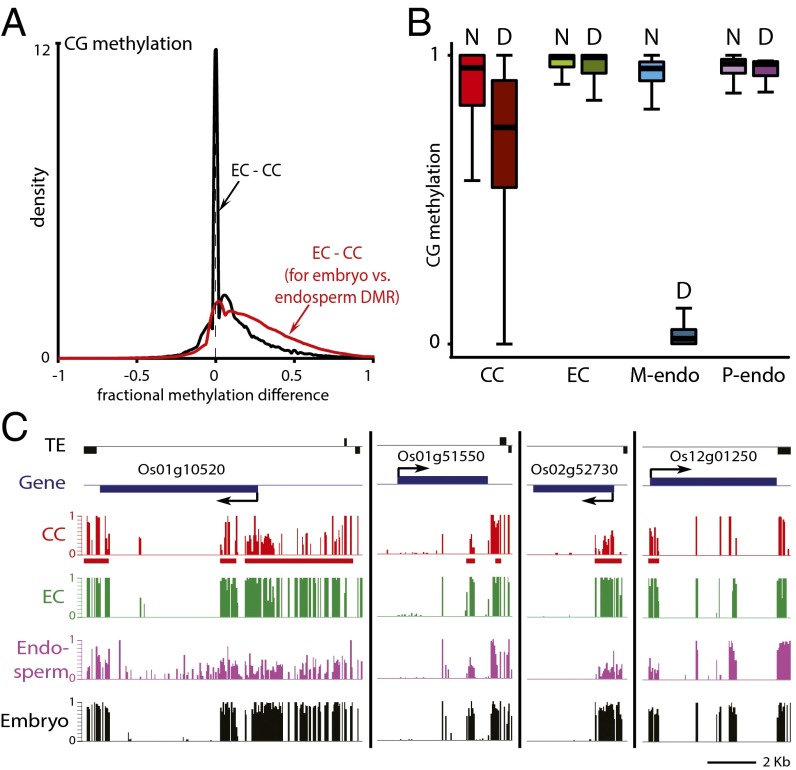
DNA demethylation is initiated in rice central cells. (A) Density plot showing the frequency distribution of CG DNA methylation differences between egg cell (EC) and central cell (CC) 50-bp windows with at least 10 informative sequenced cytosines in both samples and 70% methylation in one of the samples. The analysis marked by the red trace is confined to DMRs in the CG context between embryo and endosperm (12). (B) Box plots show CG methylation levels of 50-bp windows in the indicated cell type. Only windows with methylation greater than 70% in either embryo or endosperm, at least 20 informative sequenced cytosines in both tissues, and at least 20 sequenced cytosines in the graphed sample (10 for central and egg cells) are included. D, within CG DMRs between embryo and endosperm; M-endo, maternal endosperm; N, outside CG DMRs between embryo and endosperm; P-endo, paternal endosperm. (C) Snapshots of CG methylation in central cell (CC), egg cell (EC), endosperm, and embryo. DMRs between embryo and endosperm are underlined in red.

