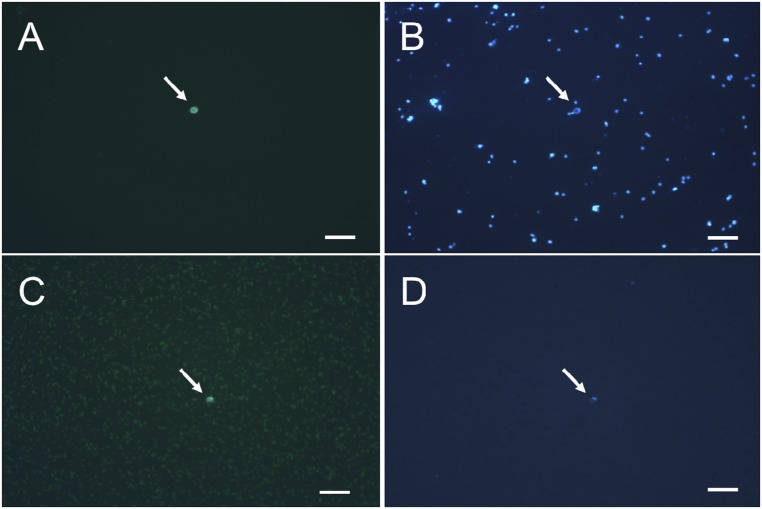
Fig. S1.
Purification of GFP-labeled central cell nuclei. Panels A and B show nuclei before binding to anti-GFP antibody beads. Panels C and D show cells after capture by anti-GFP antibody beads and purification. In panels A and C, fluorescence microscopy shows a GFP-labeled central cell nucleus. In panels B and D, light microscopy shows DAPI-stained nuclei and cells. White arrows indicate central cell nuclei. (Scale bars, 50 μm.)

