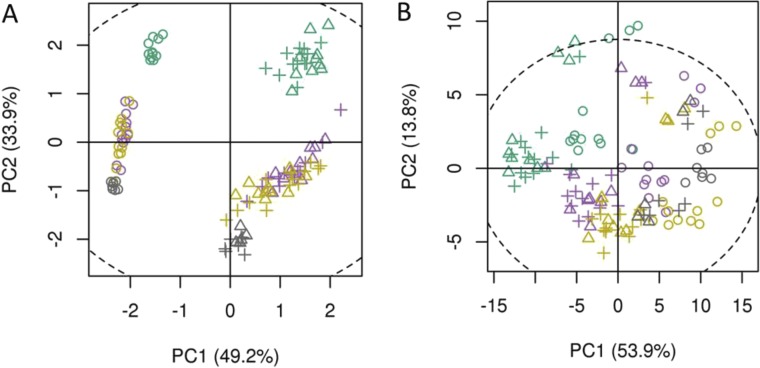
Fig. S5.
Principal component analysis (PCA) of UPLC-MS (A) and GC-MS (B) data of four leaf types from segregating cyp71av1-1 mutant populations. PCA of 55 UPLC-MS identified peaks (A) and 47 GC-MS identified metabolites (B). Leaf types, corresponding with Fig. 1 are represented by colors: green, leaf 1–5; purple, leaf 7–9; brown, leaf 11–13; gray, oven-dried leaf. Genotypes represented by shapes: circles, homozygous cyp71av1-1; triangles, heterozygous cyp71av1-1; crosshairs, segregating WTs. Only PC1 and PC2, which have explained maximal variance, are shown. PCA was performed on log-scaled data and mean-centered data; dotted ellipse, Hotelling’s 95% confidence interval.

