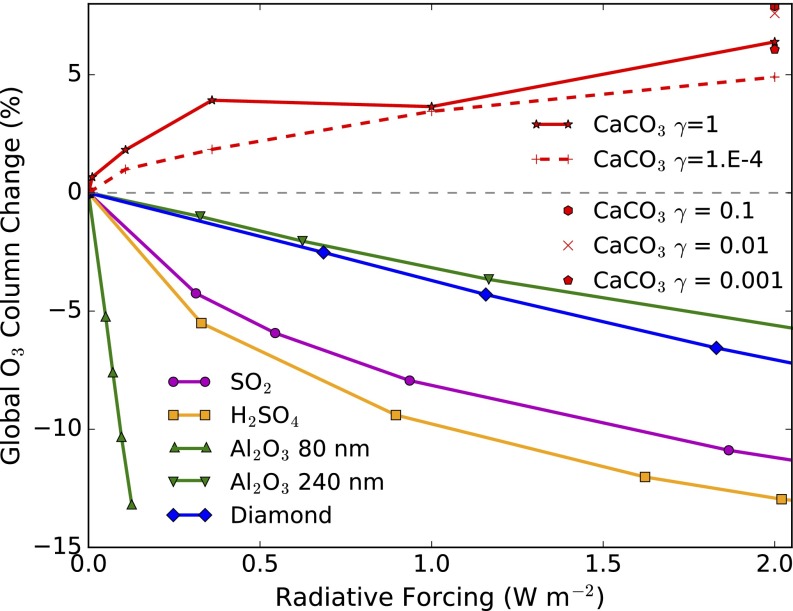
Fig. 3.
Trade-off between ozone loss and radiative forcing from geoengineering. Change in annual average global column ozone is plotted versus the computed aerosol radiative forcing. Changes in ozone are computed with respect to a 2040 baseline. Positive values represent an increase in ozone. Results for calcite injection rates ranging from 0.3 Tg⋅y−1 to 5.6 Tg⋅y−1 shown (red line and symbols) where the gas−solid reaction rates, , are varied to explore parameter uncertainty. For comparison, we show prior results for injection of alumina, diamond, and sulfate, either from injection of gas-phase SO2 or sulfuric acid (2).

