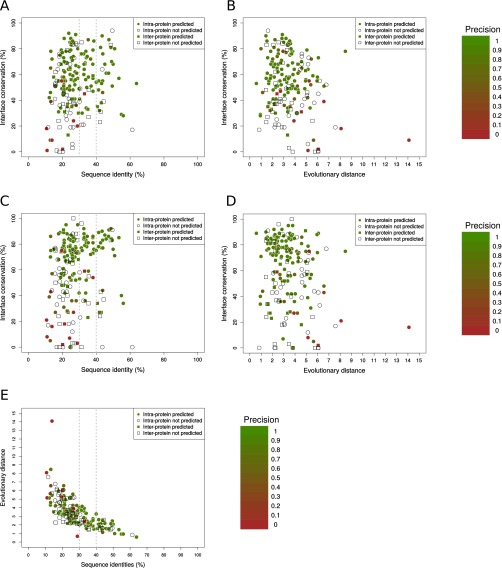
Fig. S5.
Each point represents a domain–domain interaction (interprotein in squares, intraprotein in circles) with structure in both prokaryotes and eukaryotes, colored by its contact prediction precision (white when there are not predictions). Percentages of sequence identity between the prokaryotic and eukaryotic representative complexes and interface conservation (SI Text) are also shown. (A) Precision by case in eukaryotes as a function of the percentage of sequence identity and interface conservation using contacts from the comprehensive interfaces. (B) Precision by case in eukaryotes as a function the evolutionary distance and interface conservation using contacts from representative interfaces. (C) Precision by case in eukaryotes as a function of the percentage of sequence identity and interface conservation using contacts from comprehensive interfaces. (D) Precision by case in eukaryotes as a function of the evolutionary distance and interface conservation using contacts from representative interfaces. (E) Evolutionary distances versus sequence identity plot. Each point corresponds to a domain–domain pair having both a prokaryotic and a eukaryotic experimentally solved structure. (188 cases, Spearman’s correlation = −0.79; SI Text).

