Fig. 5.
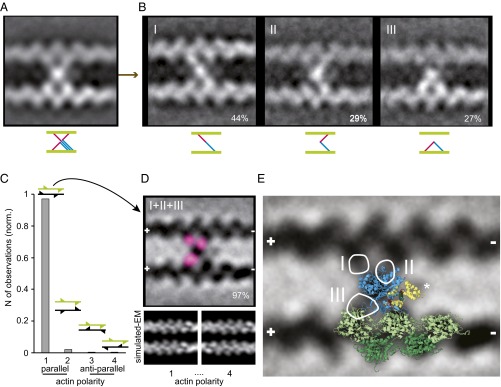
Interpretation of IXa-MD–induced actin cross-links using a modeled crystal structure. (A) Class average of 981 actomyosin-IXa cross-links. The polarity of the actin filaments was not taken into account. (B) The classification revealed three different conformations; the frequency of observation is given in percentage. (C) Cross-correlation with low pass-filtered parallel and antiparallel in and out of phase actin models showed that 97% of the cross-links were formed between parallel actin filaments, aligned in phase (polarity 1, 2.2% polarity 2, 0.4% polarity 3 and 4). The fins in the cartoons of two actin filaments indicate the polarity and phase. (D) Realigned class average (inverted) of the 221 cross-links between parallel actin filaments aligned in phase. The variance analysis between the realigned cross-links resulted in three hotspots (pink), indicating three secondary myosin-binding sites on actin, consistent with the three myosin conformations identified in B. (E) The IXa-MD cross-links were interpreted using an actomyosin-IE structure, including a calmodulin modeled onto loop 2. The optimized projection of the model was overlaid onto the real-EM class average (actin monomers, green; myosin motor domain, blue; calmodulin bound to loop 2, yellow). The circles mark the hotspots of variance seen in D, and the roman numerals denote the different conformations shown in B.

