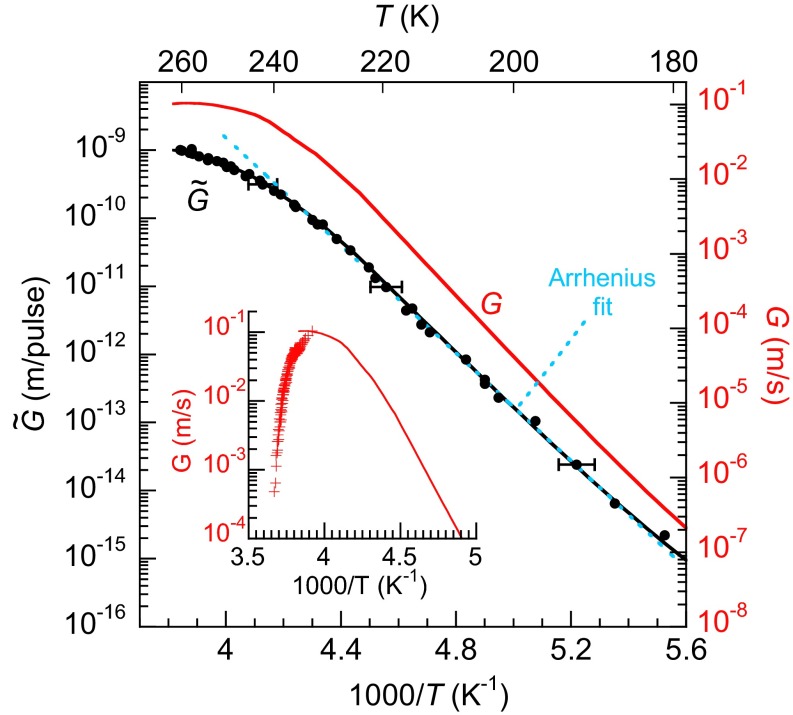
Fig. 2.
and G(T) vs. inverse temperature. The black circles show the measured values for . exhibits Arrhenius behavior (∼76 kJ/mol) for Tmax < 235 K (blue dashed line). The measured growth rates are the integrals of G(T) over a heat pulse, T(t), with a maximum temperature, Tmax (Eq. 1). The red line shows a form of G(T) that reproduces the results of the pulsed-heating experiment (black line). The Inset compares previous measurements of G(T) for macroscopic samples (32) (crosses) to the current experiments on nanoscale water films (red line). For , the vertical size of the symbols is representative of the uncertainty in the measurements (±20%). Horizontal error bars, which show the lateral distribution of temperatures on the sample during the heat pulses, are shown for a few points.

