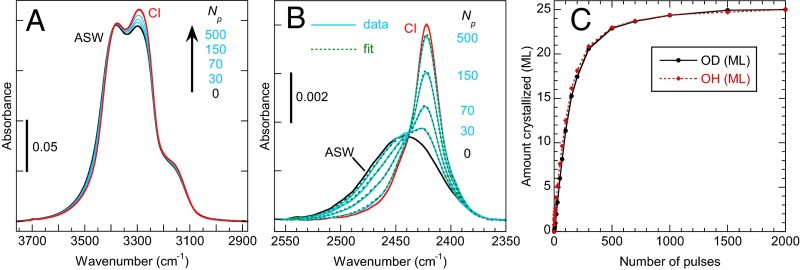
Fig. S3.
The IRAS spectra in the OH-stretch (A) and OD-stretch (B) regions evolve as a function of number of pulses applied for Tmax = 225 K. (C) The amount crystallized vs. the number of pulses as determined from the IRAS spectra in the OH-stretch (red diamonds) and OD-stretch (black circles) regions.

