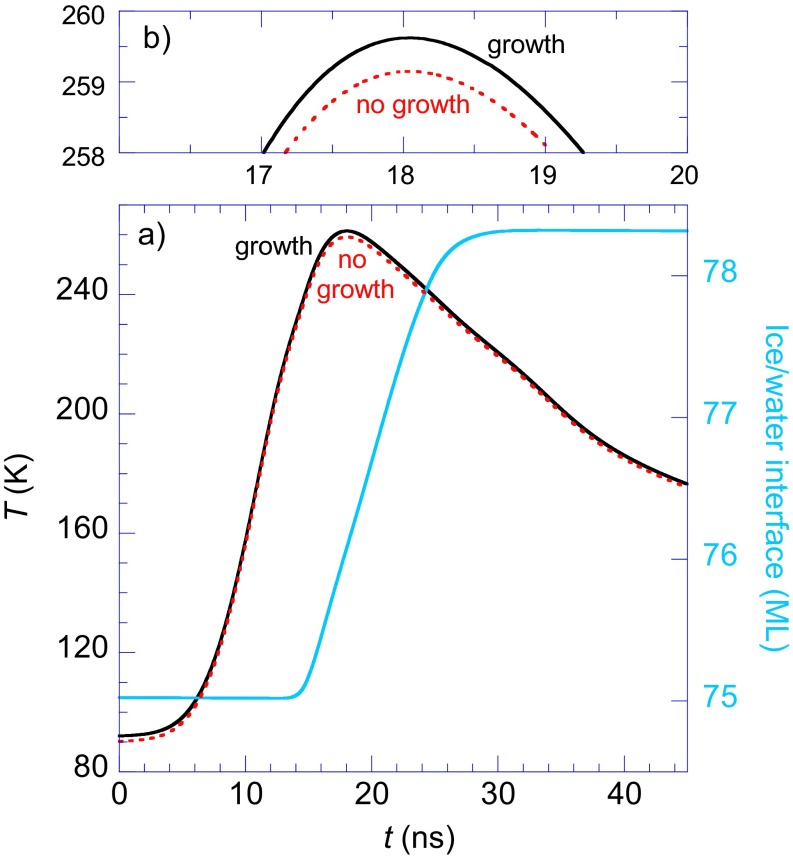
Fig. S6.
(A) Calculated temperature and position of the ice/water interface vs. time during pulsed-laser heating. The black and red lines show T(t) at the ice/water interface for calculations with and without crystallization and the accompanying latent heat of fusion, respectively. For the calculation where crystallization is included, the blue line shows the position of the ice/water interface as a function of time. The ice/water interface advanced 3.3 ML during the pulse. (B) Expanded view of T(t) near Tmax.

