Fig. 2.
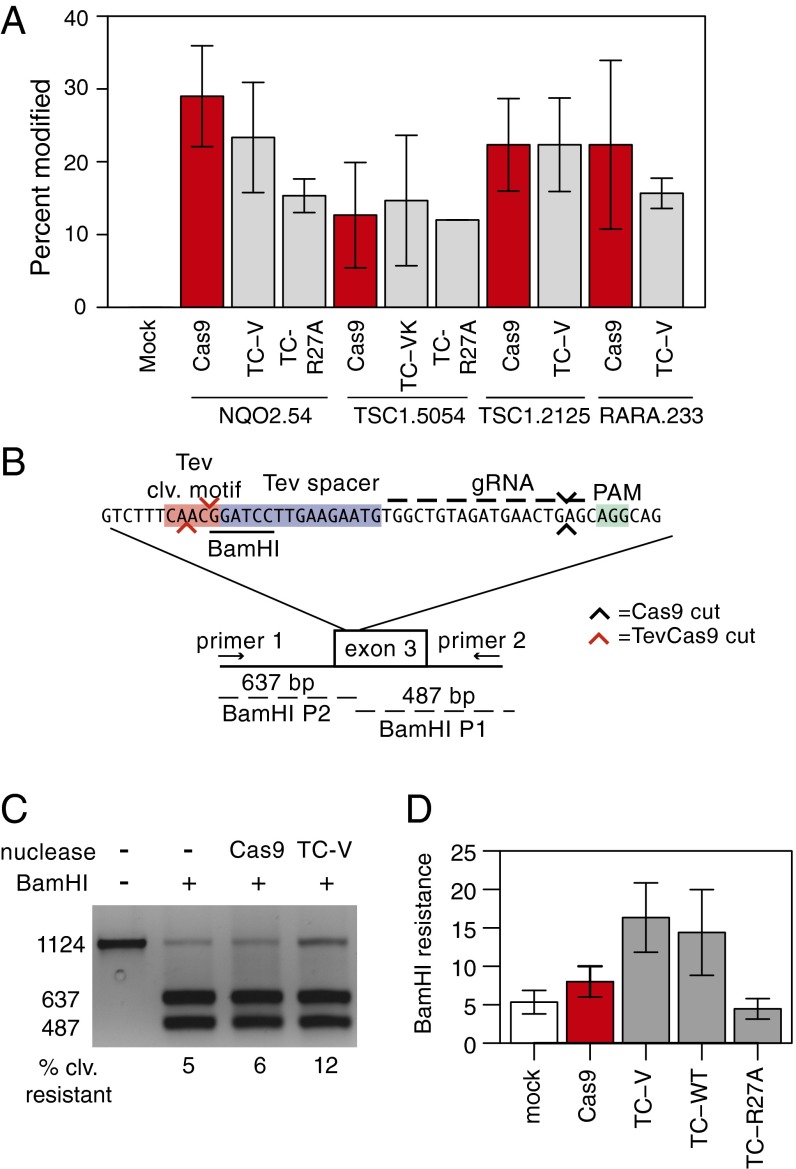
TevCas9 activity in HEK293 cells. (A) T7E1 mismatch cleavage assays of PCR amplified target sites after transfection with Cas9 or TevCas9. TC-V, TevCas9-V117F; TC-VK, TevCas9-V117F/K135N; TC-R27A, TevR27ACas9 (R27A inactivates I-TevI cleavage activity). (B) TevCas9 target site in exon 3 of the human NQO2 gene, positions of PCR primers used for amplification, and sizes of BamHI cleavage products. The I-TevI cleavage motif and DNA spacers are highlighted by red and blue rectangles and the PAM motif by a green rectangle. I-TevI and Cas9 cleavage sites are represented by red and black arrows, respectively. (C) Agarose gel of BamHI cleavage assays on PCR products amplified from the NQO2 locus. Substrate (1,124 bp) and two BamHI cleavage products (673 bp and 487 bp) are indicated on the Left. The percent of substrate resistant to cleavage by BamHI is indicated below each lane. (D) Activity of TevCas9 variants at the NQO2 site measured by BamHI resistance. TevCas9 variants labeled as in A. In A and D, barplots are mean values of at least three independent experiments, with vertical bars representing SD.

