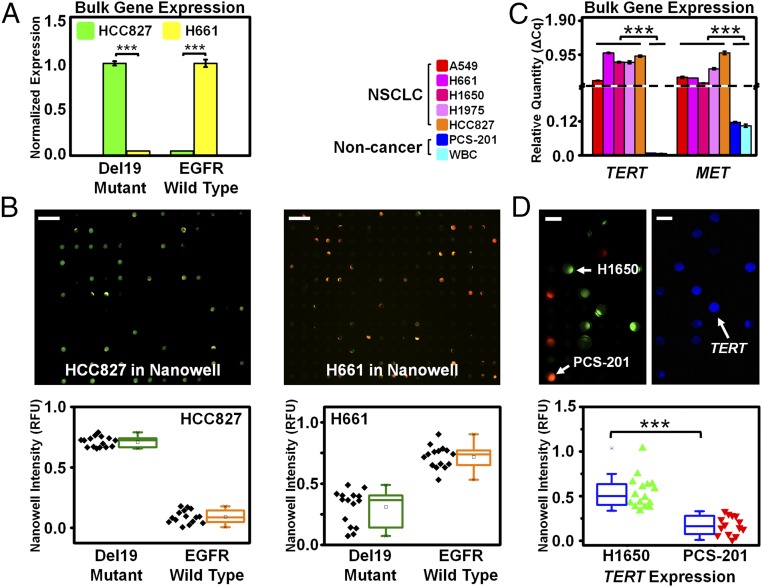
Fig. 2.
Translating bulk gene expression to single-cell gene expression profiling on Nanowell using cell lines. (A) Two cell lines (HCC827 and H661) were selected according to their EGFR exon 19 deletion (del19) mutational status (mutant and wild type, respectively). Bulk expression analysis by PCR showed that HCC827 cells exhibited measured signal for only the EGFR E746-A750del (the most common EGFR del19 mutation shown in green), with undetectable wild-type EGFR. In contrast, H661 cells exhibited measured signal for only the wild-type EGFR shown in yellow, with undetectable E746-A750del. (B) The same two cell lines each underwent single-cell analysis on Nanowell using EGFR E746-A750del and wild-type probes in FAM (shown in green) and HEX (shown in orange) channels, respectively. HCC827 cells exhibited fluorescence predominantly in the FAM channel, indicating the presence of EGFR del19 mutation. (Scale bar, 200 µm.) In contrast, the assay of H661 cells exhibited fluorescence predominantly in the HEX channel, indicating the presence of wild-type EGFR. (Scale bar, 200 µm.) For each cell line, we observed a clear differentiation between the EGFR mutant and wild-type expression levels from single cells in Nanowell, and the bulk expression measurements matched the corresponding Nanowell signal, with high statistical significance (P < 0.0001 for both cases, t test). (C) Bulk gene expression among five NSCLC cell lines (A549, H661, H1650, H1975, and HCC827), a noncancerous fibroblast cell line (PCS-201), and WBCs are shown by quantitative RT-PCR. The five cancer cell lines exhibited high TERT and MET gene expression, whereas the fibroblast cells and WBCs exhibited no TERT and low MET expression. (D) Single-cell analysis using Nanowell on cancer and noncancer populations by RT-PCR expression analysis on H1650 and PCS-201 cell lines. (Scale bar, 50 µm.) Each cell line was stained with different CellTracker dyes (green for H1650; orange for PCS-201) and then imaged to illustrate the concordance between each cell’s Nanowell location and RT-PCR signal (TERT shown in blue). Nanowell showed a clear differentiation between H1650 (cancer; n = 16) and PCS-201 (noncancer; n = 14) cell lines based on TERT expression, with high statistical significance (P < 0.0001, t test).

