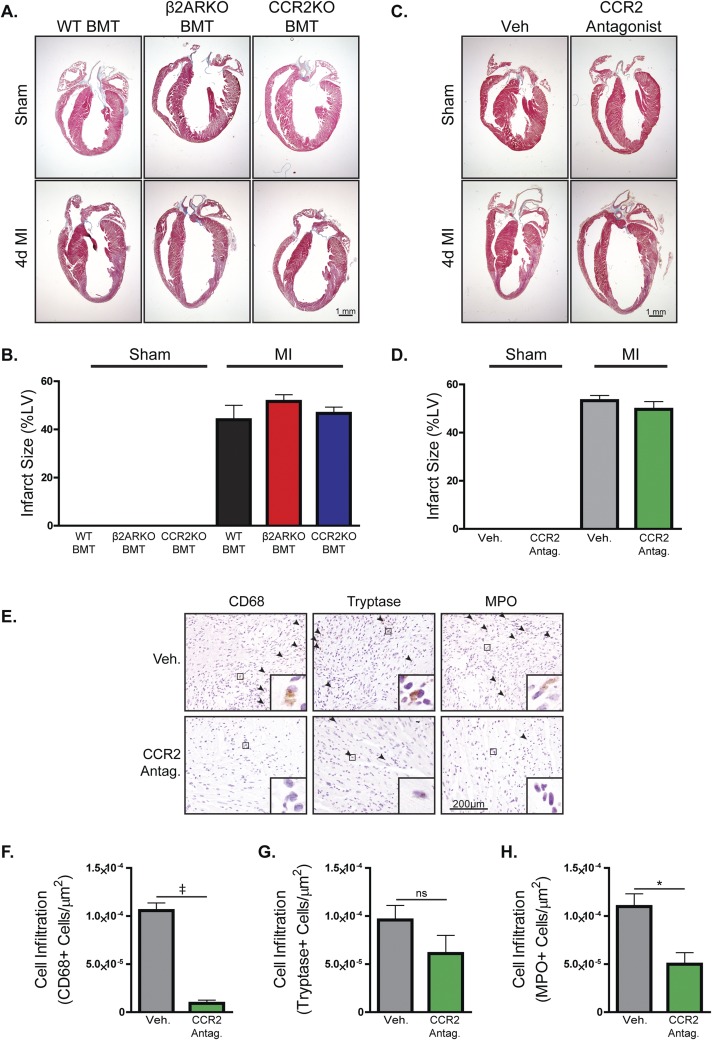
Fig. S2.
Infarct size and leukocyte infiltration with CCR2 inhibition and CCR2KO BMT. (A) Representative Masson’s trichrome staining for hearts from WT C57BL/6 mice that underwent MI surgery followed by administration (i.p.) of 2 mg⋅kg−1⋅d−1 of a CCR2 antagonist or vehicle (Veh) for 4 d. (B) Quantification of Masson’s trichrome staining for sham and 4-d post-MI hearts from Veh- and CCR2 antagonist-treated mice. n = 4–10. (C) Representative Masson’s trichrome staining for hearts from WT C57BL/6 mice receiving WT, β2ARKO, or CCR2KO BMT that underwent MI surgery. (D) Quantification of Masson’s trichrome staining for sham and 4-d post-MI hearts from WT, β2ARKO, or CCR2KO BMT mice. n = 4–10. (E) Representative CD68, tryptase, and MPO staining for the border zone of hearts from WT C57BL/6 mice that underwent MI surgery followed by administration (i.p.) of 2 mg⋅kg−1⋅d−1 of a CCR2 antagonist or Veh for 4 d. Arrowheads indicate positive staining. Insets show higher magnification at 250×. (F–H) Quantification of CD68 (F), tryptase (G), and MPO (H) staining for the border zone of 4-d post-MI hearts from Veh- and CCR2 antagonist-treated mice. n = 4–8; t test, *P < 0.05 vs. Veh, ‡P < 0.001 vs. Veh. Data are expressed as mean ± SEM.

