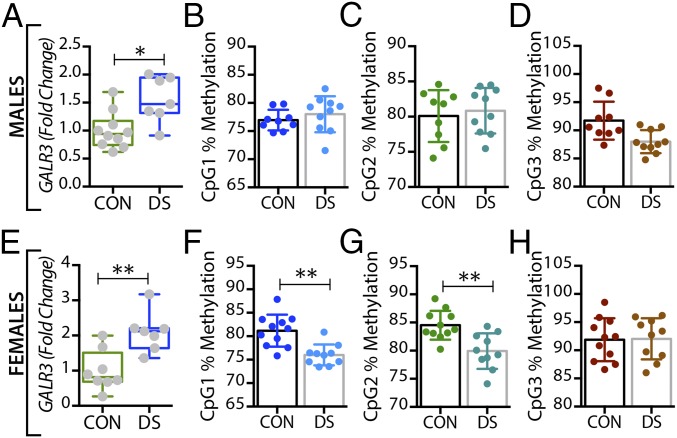
Fig. 5.
Alterations in GALR3 gene expression and DNA methylation in the dorsal raphe nucleus of male and female DS subjects. (A and E) Gene-expression levels of GALR3 in the dorsal raphe nucleus of male (A) and female (E) controls and DS subjects. (B–D and F–H) Percentage of DNA methylation levels at individual CpG sites of the GALR3 gene in male (B–D) and female (F–H) controls and DS subjects. All data are presented as mean ± SEM; males: n = 11 controls, 10 DS subjects; females: n = 11 controls, 10 DS subjects. Significant differences between DS subjects and controls are indicated: *P < 0.05, **P < 0.01. CON, controls; DS, depressed suicide.

