Fig. 3.
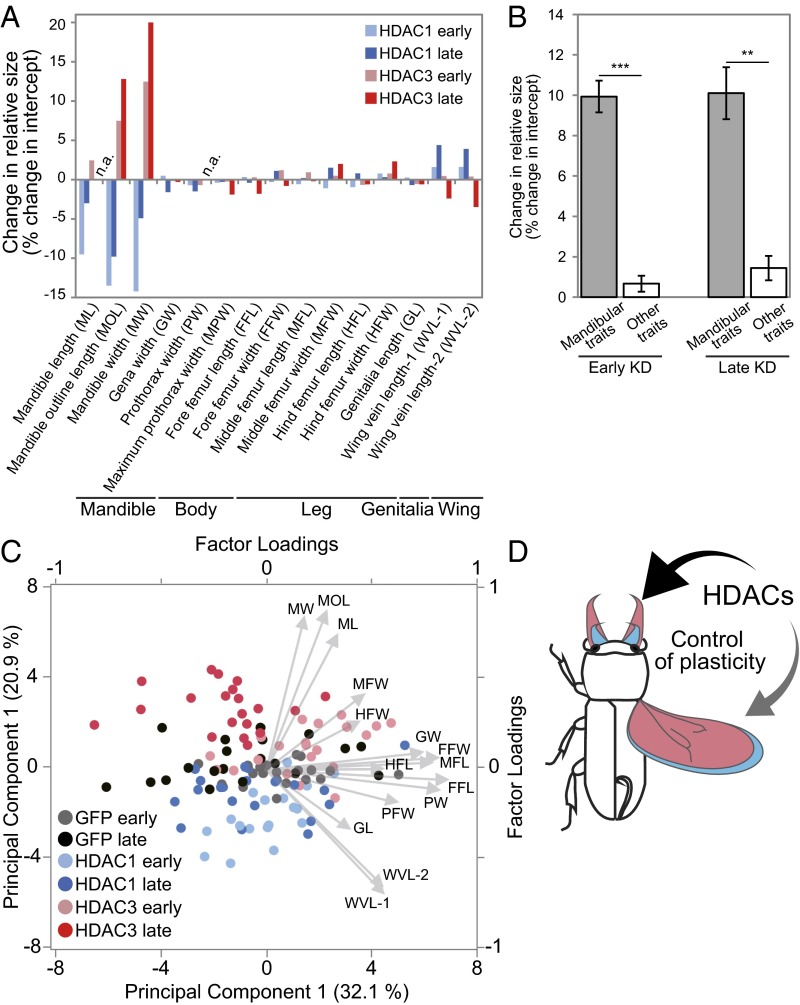
Overall phenotypic changes caused by HDAC1 and HDAC3 KDs. (A) Changes in adjusted trait sizes (i.e., changes of intercepts in ANCOVA with body size as covariates) (Fig. 2 C–H and SI Appendix, Figs. S4 and S5 and Tables S6 and S7). Light blue, HDAC1 early KD; blue, HDAC1 late KD; pink, HDAC3 early KD; red, HDAC3 late KD; n.a., not applicable because of significant changes in slopes. (B) Magnitudes of changes in mandibular traits (ML, MOL, and MW) and 12 other body traits under early- and late-HDAC KD conditions. Magnitudes of changes (changes of intercepts in absolute values) were significantly greater for mandibular traits than for other somatic and genital traits (early KD: P < 0.001, Z = 3.71; late KD: P = 0.0012, Z = 3.24; **P < 0.01, ***P < 0.001, U test). Mean ± SD values are shown. (C) PCA performed on the detrended data of 15 body traits [residuals of linear regression to body size (i.e., elytra width)]. PC1 indicates the relative sizes of organs, except the mandible and genitalia (factor loadings are provided in SI Appendix, Table S8). PC2 indicates an increase in relative mandible size and decrease in relative wing size. Arrows indicate factor loadings (also SI Appendix, Table S8). Note that the phenotypes of early- and late-HDAC1 KDs (light blue and blue dots) occupied distinct morphospaces to early- and late-HDAC3 KDs (pink and red dots) across the GFP control phenotype (black dots), suggesting that KD of HDAC1 and HDAC3 caused opposite phenotypic changes. (D) Schematic diagram of HDAC-mediated, module-specific plasticity. HDAC1 (blue) and HDAC3 (red) have antagonistic effects on mandible and wing sizes.

