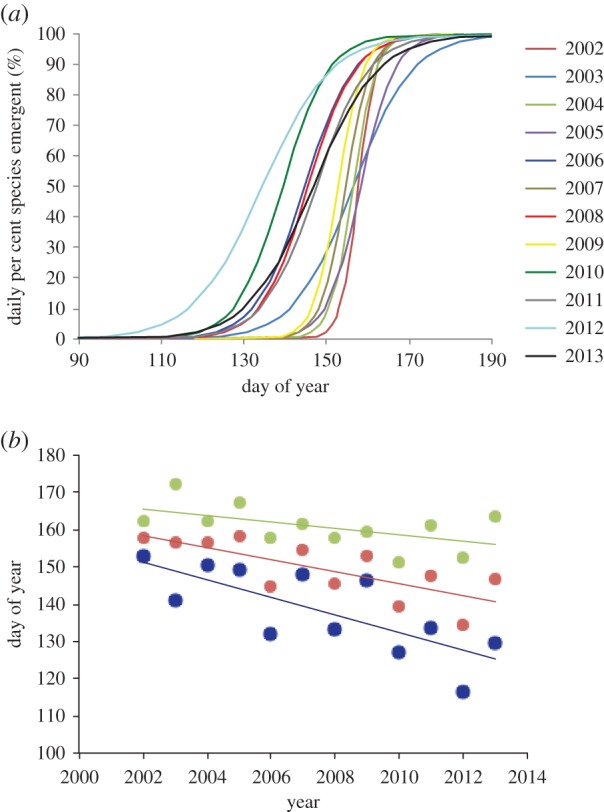
Figure 2.

(a) Phenological progression during each year expressed as daily percentages of the total number of species emergent across all plots. (b) Annual dates of onset (10% emergence, blue), mid-point (50% emergence, red) and end (90% emergence, green) of community-level emergence (2002–2013).
