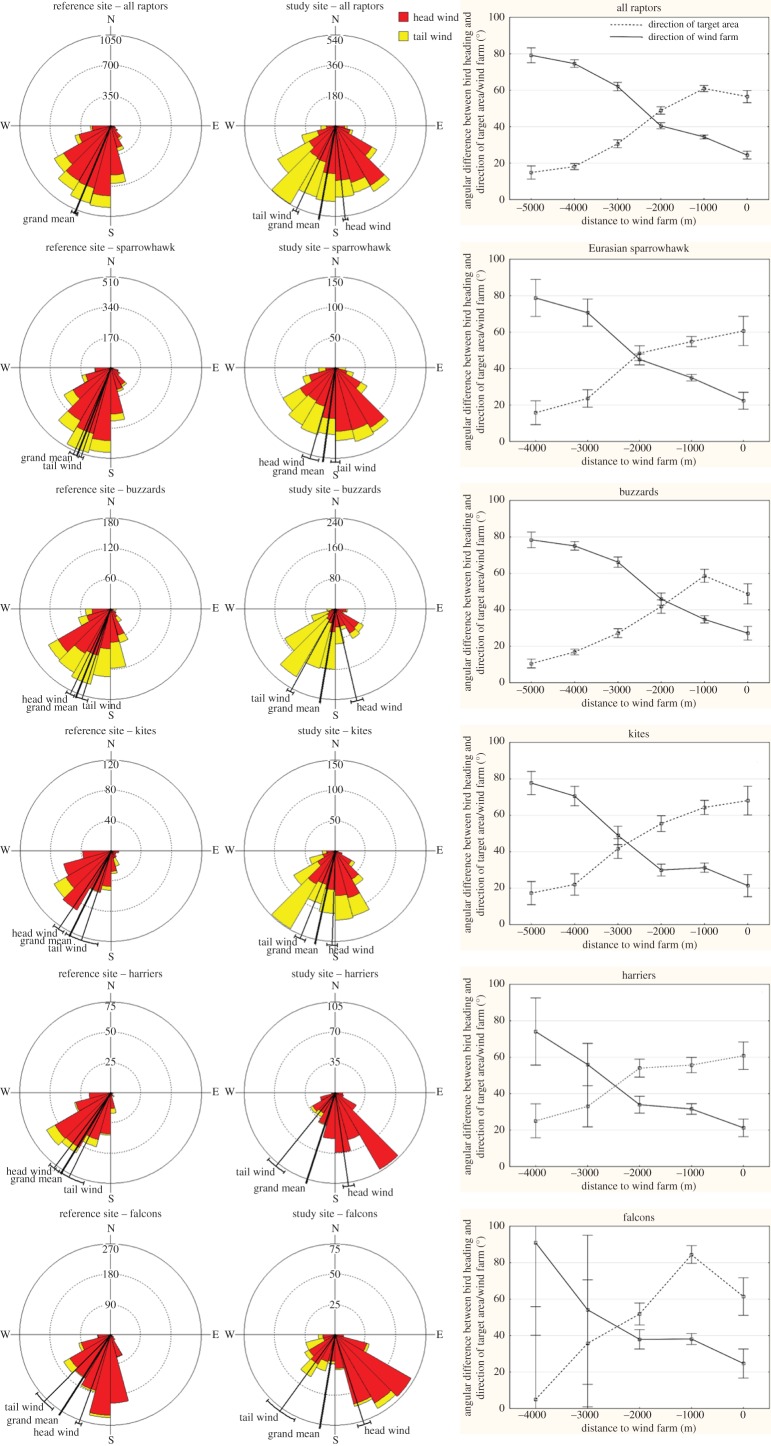
Figure 2.
Directional histograms demonstrating differences in migration directions of raptors between study and Gedser reference sites in 2011 (left panel), and relationship between migration direction of raptors at study site and distance to marine wind farm (right panel). Numbers on the Y-axes of histograms refer to sample size (number of tracks recorded by radar and laser rangefinder). Each wedge represents a sector of 15°. The mean direction in tail and head winds is indicated by the black lines running from the centre of the graph to the outer edge; the grand mean indicates the mean direction across all wind directions. The arcs extending to either side represent the 95% confidence limits of the mean directions. The two lines shown in the right panel reflect the angular difference between bird heading and the direction of the target area on the German coast, and the angular difference between bird heading and the direction of the wind farm as a function of distance to the wind farm. Mean and 95% confidence intervals of angular differences are shown. All raptor species changed their mean migration direction as they approached the marine wind farm. Mean migration directions were initially towards the SW (direction towards closest point on German coast) at 4–5 km distance, and shifted towards the marine wind farm located in the S and SE direction when the raptors reached a distance to the marine wind farm of less than 2 km.

