
Figure 4.
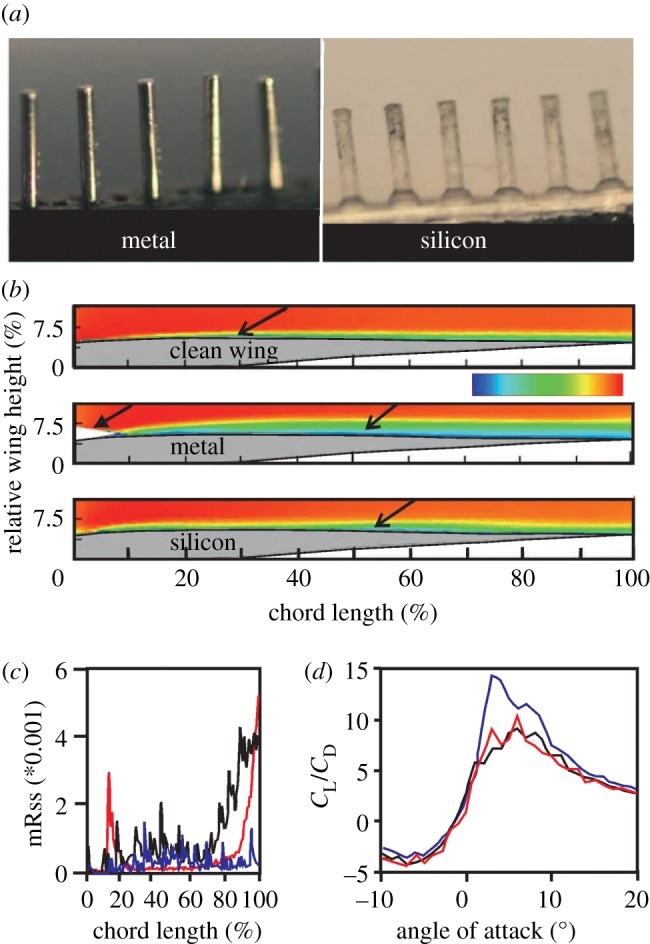
Aerodynamic effect of serrations. (a) The two different types of artificial serrations used. (b) Flow field measured at 0.9 spanwise position, an angle of attack of 3° and a Reynolds number of 60 000. The inset shows the velocity scale (u/u∞, u∞ = freestream velocity) ranging from 0 (blue) to 1 (red). The open arrows point to the upper wing surface. The filled arrowhead points to a reflection close to the leading edge that prevented recording of data. (c) Maximum Reynolds shear stress (mRss) as a function of chord length for the different wing configurations. (d) The lift-to-drag ratio as a function of the angle of attack for the different wing configurations. CL and CD are the lift and drag coefficients, respectively. Red, metal; black, silicon; blue, clean wing. The relative wing height is the quotient of height z divided by chord length c in per cent. Data in (b), (c) and (d) were redrawn after figs 4, 6a and 11d in Winzen et al. [49], respectively.