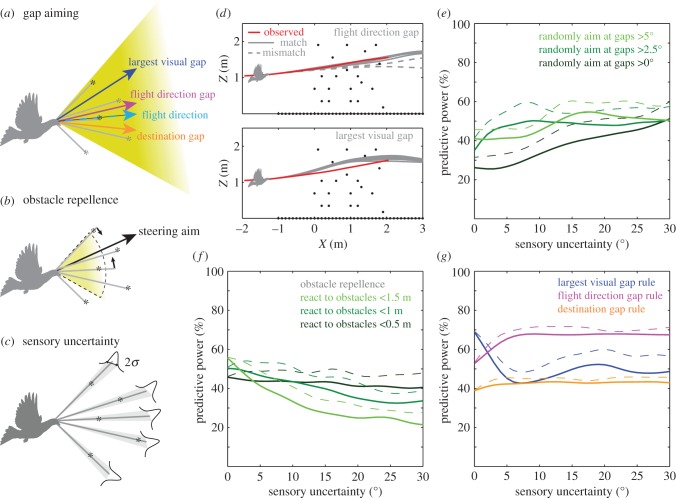
Figure 6.
Aiming for gaps most aligned with the flight direction best predicts the observed limited steering past horizontal obstacles in the pigeon. The pigeon's guidance strategy was evaluated by simulating four simple steering rules given observed initial conditions. (a) Following the gap-aiming paradigm that we introduced in previous work [34], we categorize gaps between obstacles (denoted by asterisks) based on their angular size and position: largest visual gap, flight direction gap and destination gap. Gaps are considered within a ±30° attention cone (yellow shading) over a range of 1.5 m (the maximum steering and reaction distance we observed for vertical obstacle navigation). Our model assumes that the pigeon steers towards one type of gap throughout its obstacle flight. (b) As a reference, we implemented an obstacle repellence model [35] in which each obstacle within a certain range contributes to the steering aim of the pigeon. The pigeon's steering aim results from the weighted contribution of all obstacles within this range. (c) In reality, animals can never perfectly measure obstacle positions. We simulate this sensory uncertainty by introducing Gaussian noise, with a tunable standard deviation. (d) Given a sensory uncertainty of 5°, the model pigeon generates different trajectories from the same initial conditions. Some trajectories match the observed trajectory (solid grey lines) and some do not (dashed grey lines). Here, we show one particular trial simulated by two different gap-aiming rules. By repeating the simulation 50 times, we quantify the predictive power of a specific guidance rule. (e) To establish a baseline for the predictive power of different steering rules, we first simulate randomly chosen gaps given a minimum gap size threshold. The average predictive powers (solid lines) for all three conditions are below 50% given zero sensory uncertainty. As sensory uncertainty increases, the random gap selection simulations converge to 50%, with the maximum predictive powers (dashed lines) approaching 60%. (f) The obstacle repellence model has average predictive powers (solid lines) close to 50% at zero sensory uncertainty but degrades quickly as sensory uncertainty increases, particularly when guided by more distant obstacles. A similar trend is observed in maximum predictive powers (dashed lines). (g) The largest visual gap rule (blue) exhibits the highest predictive power at zero sensory uncertainty, but drops quickly with as little as 5° sensory uncertainty. The flight direction gap rule (magenta) is most robust and maintains predictive power close to 70% from 5° to 30° sensory uncertainty. The destination gap rule (orange lines) never predicts more than 50% of the flights. The flight direction gap rule maximally predicts the actual flight trajectories by just over 70% (pink dashed line). (Online version in colour.)

