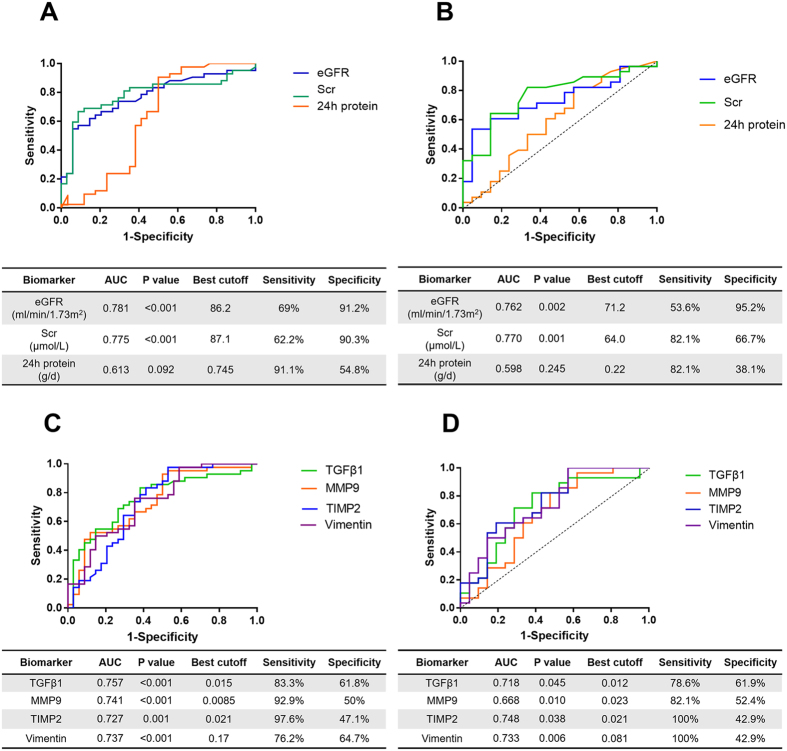
Figure 4. The diagnostic power of individual mRNAs and routine parameters in TIF by ROC curve analyses.
(A,B) the performance of eGFR, SCr and 24 h protein in diagnosing TIF in test set (A) and validation set (B). (C,D) the performance of TGFβ1, MMP9, TIMP2 and vimentin mRNAs in diagnosing TIF in test set (C) and validation set (D).

