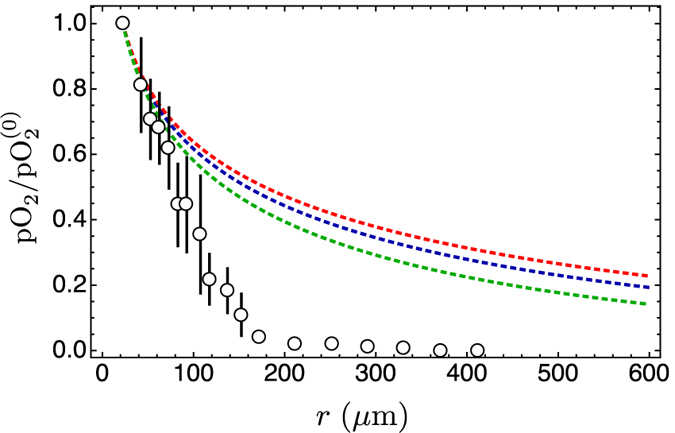
Figure 1. Comparison of model predictions with experimental data.

The experimental data have been redrawn from Fig. 3 in ref. 35 and refer to measurements of partial oxygen pressure (pO2) in the tumour interstitium as a function of the distance from blood vessels (circles; bars represents the s.e.m. calculated from 15 samples). Here pO2 has been normalised with respect to the central value in the nearest blood vessel ( ). The lines represent the stationary solutions obtained from a reaction-diffusion model–discussed further on in the main text–with different values of the oxygen diffusion coefficient and with a measured consumption rate. Blue line: measured value of the diffusion coefficient in the tumour interstitium; red line: diffusion coefficient of oxygen in water, almost twice larger than the diffusion coefficient in the interstitium; green line: diffusion coefficient halved with respect to measured value in the interstitium; the oxygen consumption coefficient is taken as the measured value in refs 28, 29, 30. It is clear that the inadequacy of the stationary solutions does not depend on the variability of the diffusion coefficient.
