
Figure 8. Monte Carlo simulation of model predictions that takes into account both the spread of frequencies and the spread of blood vessel radii (in the stationary cases, only the random distribution of the blood vessel radius is taken into account).
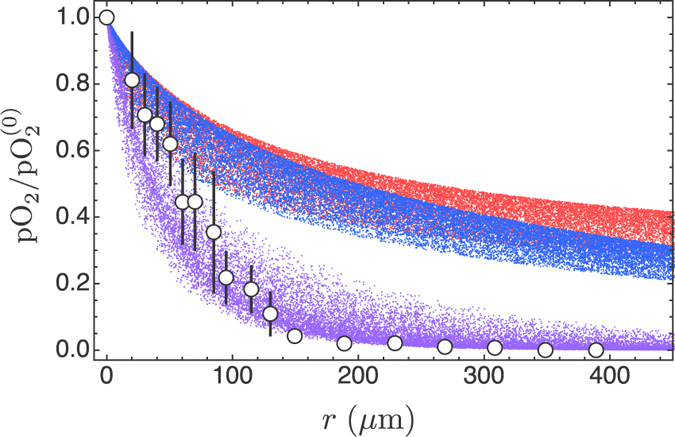
Again, we plot pO2 normalised with respect to the central value in the nearest blood vessel ( ); the calculation has been repeated 20000 times for the stationary case (blue dots), the stationary case with tumour cords (red dots), and the case of bursting oxygen flow (violet dots).