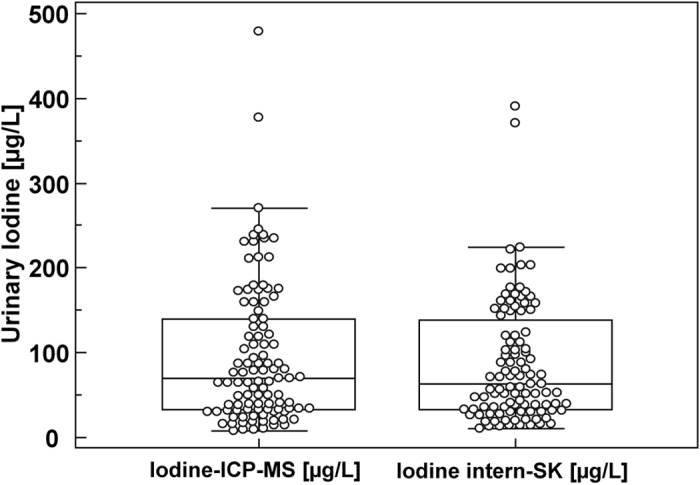
Figure 1. Box-and-whisker plots of the urinary iodine concentrations measured by the ICP-MS method and by the internal method.

Sample size n = 103 each. Each box in the figure represents the interquartile range (25th and 75th percentiles); the line inside each box is the median value. The whiskers represent the range of data up to a limit of 1.5-fold above or below the interquartile range; individual points are displayed for data exceeding the 1.5-fold limit. The two outside values (outliers) are displayed as separate circles. Box-and-whisker key numbers: 
