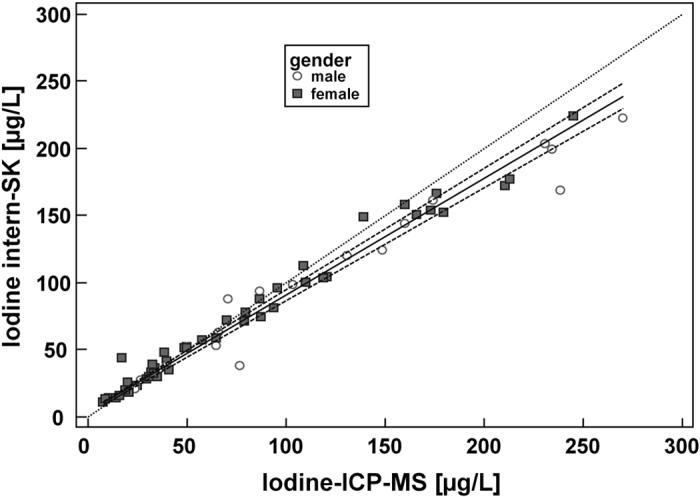
Figure 2. Comparison of the ICP-MS method versus the Sandell-Kolthoff method by Passing-Bablok regression.

Two sampels (>300 μg/L) out of n = 103 each are way out of the others in terms of their UI and are not shown in this diagram. Excluding these very high values did not alter the results significantly. The scatter diagram shows the regression line (solid line), the 95% confidence interval for the regression line (dashed lines) and identity line (x = y, dotted line). The regression equation for n = 101 each is y = 3.374 + 0.873x. (The regression equation for n = 103 each, not shown here, is y = 3.373 + 0.873x). Variable y: ‘internal iodine’, variable x: ‘ICP-MS iodine’.
Constant differences were evaluated by calculating the intercept of the regression within the 95% CI (intercept: 3.373, CI: 1.964–4.722). The slope is 0.873, the 95% CI 0.844–0.905. Spearman’s coefficient of rank correlation = 0.981. Significance level P < 0.0001. In summary, no bias between the two methods and no significant deviation from linearity could be detected.
