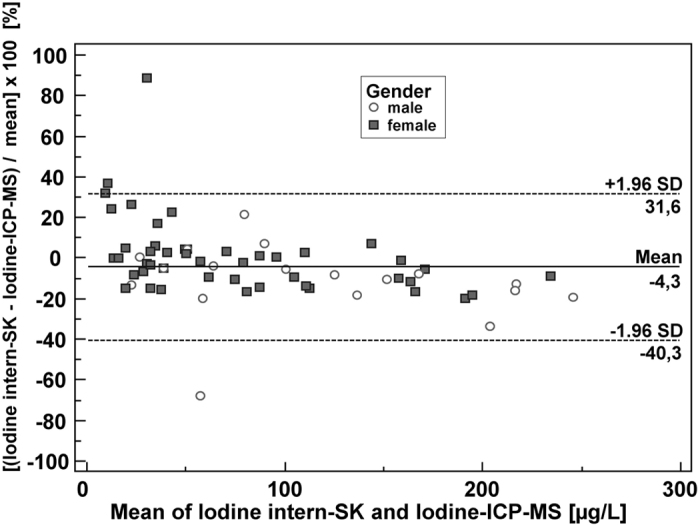
Figure 3. Bland-Altman plot to compare our two measurement techniques for iodine determination.

Sample size shown is n = 101 each. Two samples (outliers) out of n = 103 with very high UI values (>300 μg/l) are excluded in this plot, but this revision of the number of patients did not affect the overall results as compared to the plot with n = 103 (not shown). Differences between the Sandell-Kolthoff method [μg/l] and ICP-MS [μg/l], expressed as percentages of the geometric means of the paired values on the y-axis vs. the geometric mean [μg/l] of the two measurements on the x-axis are plotted. (y-axis: [geometric mean Sandell-Kolthoff method (μg/l) – geometric mean ICP-MS method (μg/l)/geometric mean (μg/l)] × 100 [%]).Horizontal lines show the mean difference and the 95% CI of limits of agreement (confidence limits of the bias), which are defined as the mean difference plus/minus 1.96 times the standard deviation of the differences. The mean differences are near the 0-line. Bias: −4.3%. In summary, no significant systematic difference between the two methods can be discerned.
