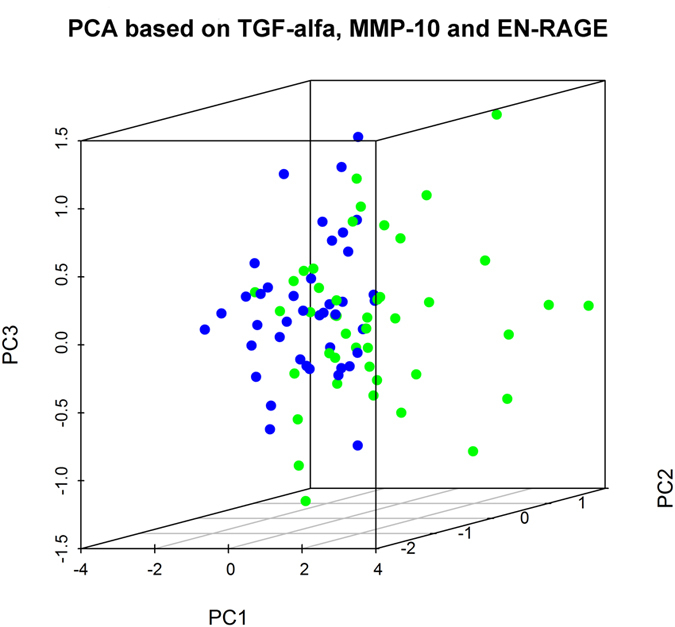
Figure 2. Dynamic three-dimensional principal component analysis (PCA) based on the three proteins with highest levels in MG patients: MMP-10, TGF-α and EN-RAGE.

The PCA indicates a tendency for clustering in the MG patients. Blue, healthy controls (HC); green, myasthenia gravis (MG) patients.
