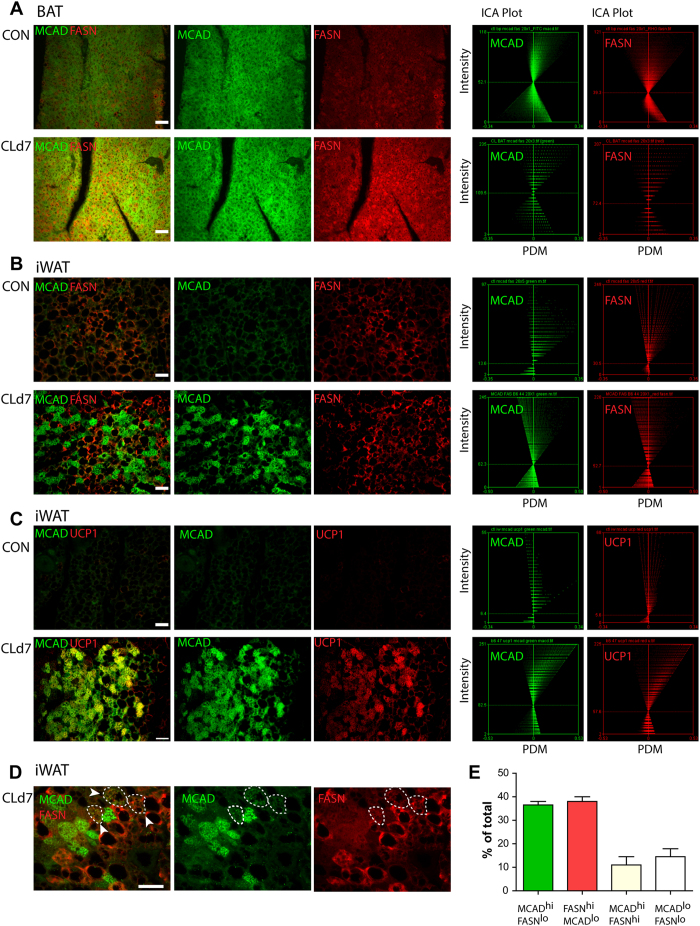
Figure 2. CL treatment increases FASN and MCAD in distinct adipocyte population.
(A) Representative images of paraffin sections of BAT double-stained for MCAD and FASN, and intensity colocalization analysis of the images. (B,C) Representative images of paraffin sections of iWAT double-stained for MCAD and FASN, or MCAD and UCP1, and intensity colocalization analysis of the images. The axes on the plots are the product of the differences from the mean (PDM) values on the x-axis and the red or green intensity on the y-axis PDM = (red intensity-mean red intensity) X (Green intensity-mean green intensity). (D) High magnification images of paraffin sections of iWAT double stained for MCAD and FASN. Circled areas (with arrowheads) indicate MCAD, FASN double positive adipocytes. (E) Quantitation of images of paraffin sections of iWAT double stained for MCAD and FASN. (n = 4, total 200 > adipocytes per condition) Size bars = 40 μm.

