
Figure 2. Relative expression of microarray and qRT-PCR.
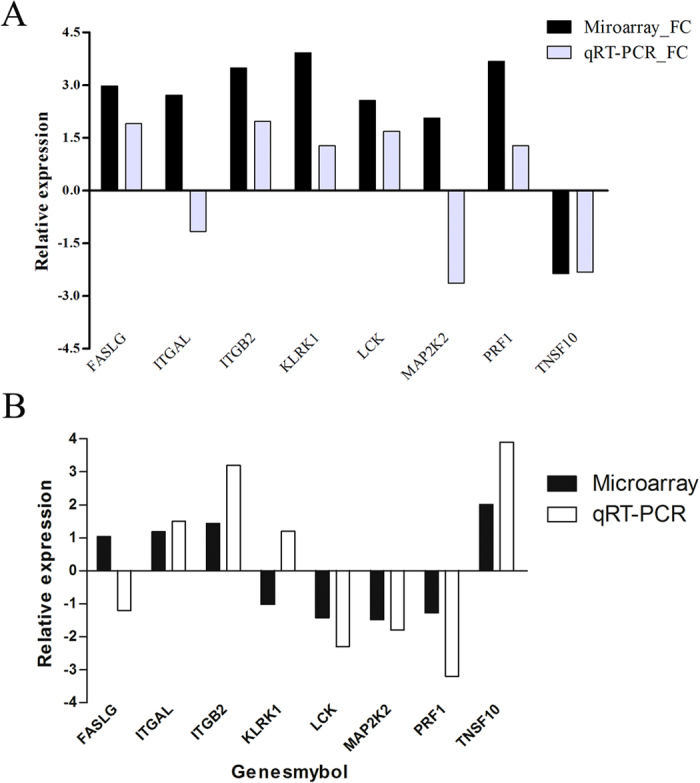
(A) The majority of genes in the NK cell-mediated cytotoxicity pathway in antagonist group compared with the control group. (B) The majority of genes in the NK cell-mediated cytotoxicity pathway in the agonist group compared with the antagonist groups.