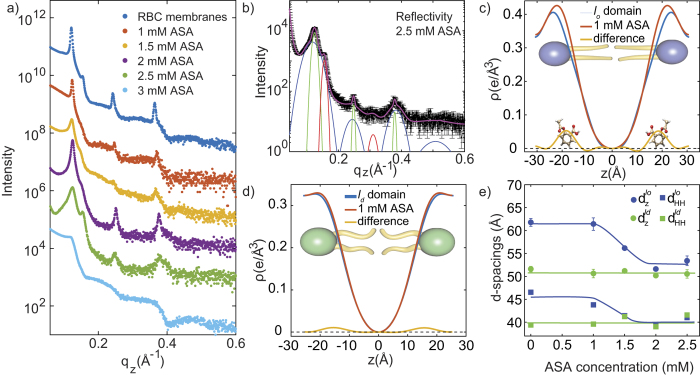
Figure 4. Analysis of the RBC/aspirin complexes.
(a) Shows all reflectivity curves for complexes containing between 0 and 3 mM ASA. (b) The pattern for the 2.5 mM sample is well fit by three series of peaks corresponding to lo, ld and peptide domains. (c) The location of the ASA molecule is determined by comparing the electron density of a pure RBC membrane with a low concentration of 1 mM ASA. Aspirin is found to partition the lo lipid domains of RBC membranes and locate in the head group region, at |z|-values of 22.8 Å. (d) Small partitioning of aspirin is observed in ld lipid domains, suggesting that aspirin preferably interacts with lo domains. (e) Lamellar spacing, dz, and membrane thickness, dHH, of the lo lipid domains decrease significantly with increasing ASA concentration until thickness of lo and ld domains coincide. We note that due to the absence of reflectivity peaks in the 3 mM ASA curve in part (a) no d-spacings could be determined for this concentration in part (e).

