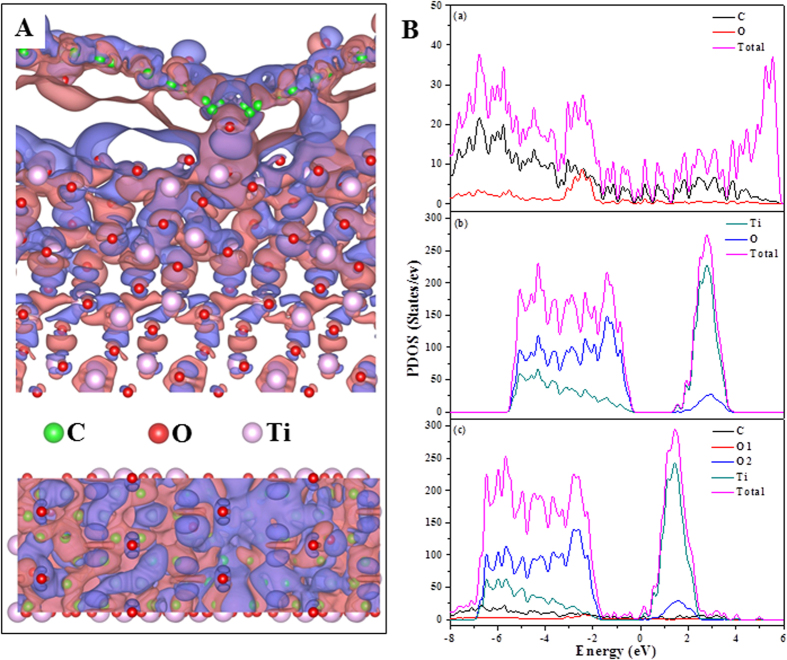
Figure 7.
(A) The distribution of differential charge density between TiO2 and GO with the isovalue of 10−5 e Å−3. Purple and blue represent positive and negative charges, respectively. Above is the side view and below is the top view. (B) Partial density of states (PDOS) of (a) GO, (b) TiO2 and (c) TiO2 + GO system. O1 is the oxygen of GO and O2 represents the oxygen in TiO2.

