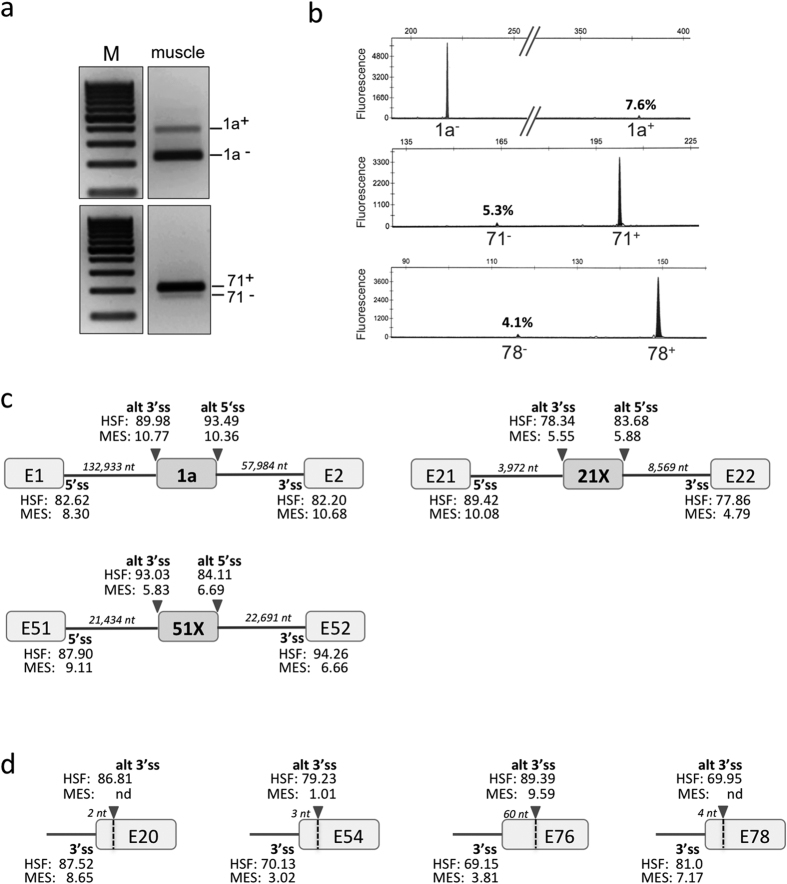
Figure 3. Biological validation of Alternative Splicing Events in skeletal muscle.
Examples of RT-PCR validations of the three most represented ASEs by (a) standard RT-PCR and agarose gel electrophoresis or (b) capillary electrophoresis analysis of fluorescent PCR products. M, molecular-weight size marker. Quantification data (mean +/−SD) from at least three independent experiments are reported in Table 3. (c) Splice-site strength of pseudoexons. MaxEntScan (MES) and Human Splicing Finder (HSF) scores are given for alternative 3′ and 5′ splice sites (alt 3′ss, alt 5′ss) of pseudoexons 1a, 21X and 51X and for splice sites of adjacent constitutive exons (3′ss, 5′ss). The size of the intronic regions (in nucleotides, nt) flanking the pseudoexon is indicated in italics. (d) Splice-site strength of alternative 3′ splice sites. MES and HSF scores are given for exonic alternative 3′ splice sites (alt 3′ss) and adjacent authentic 3′ splice sites (3′ss). nd, not detected. The vertical dotted lines mark the position of the alternative 3′ss in exons 20, 54, 76 and 78. The number of deleted nucleotides (nt, in italics) in the mature dystrophin transcript when the alternative 3′ss is used is indicated on top of each exon.

